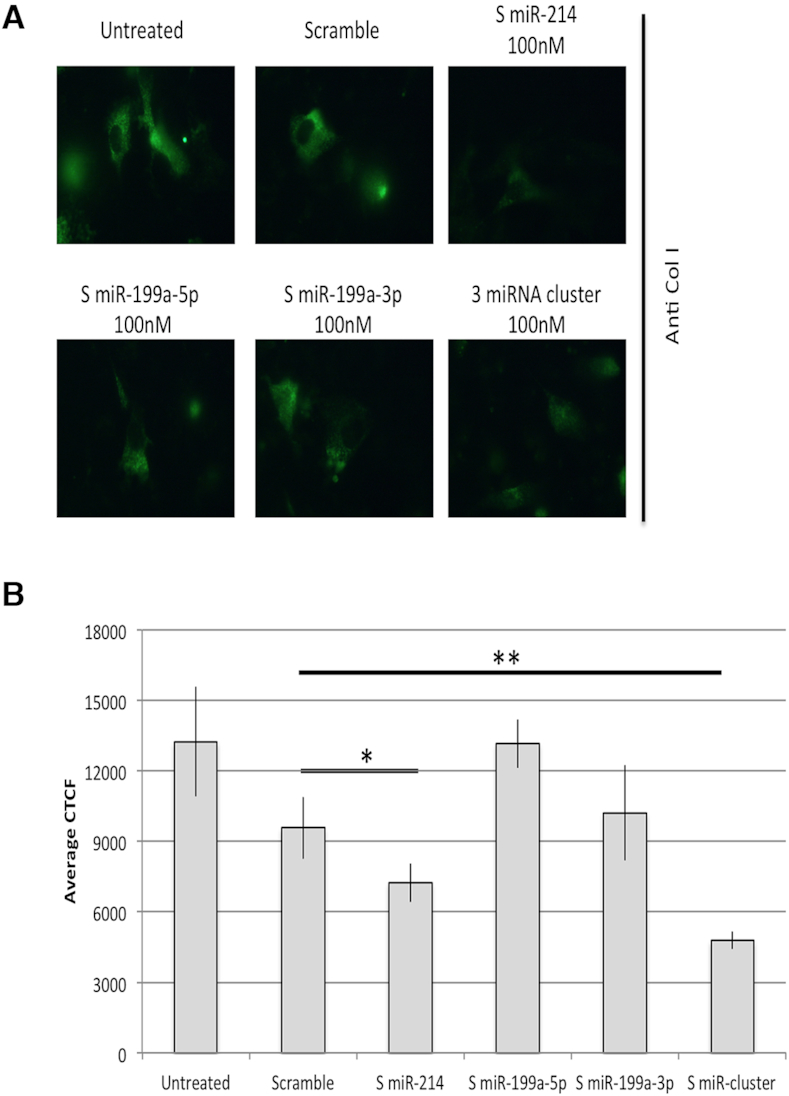
Figure 5.

Extracellular matrix (ECM) immunofluorescence assay: collagen I staining. Average of the values of fluorescence intensity of Collagen I (Col I) of single cells, after background correction. Col I immunofluorescence was performed and pictures were taken at the same exposure (1 s) and gain (6.8). The more representative pictures for each sample are shown (A). Single picture fluorescence intensity was quantified by ImageJ analysis software (n = 6 images for each sample), and CTCF method was applied and quantified (B) (t test n = 6, P value < 0.05, *; P value < 0.01, **).
