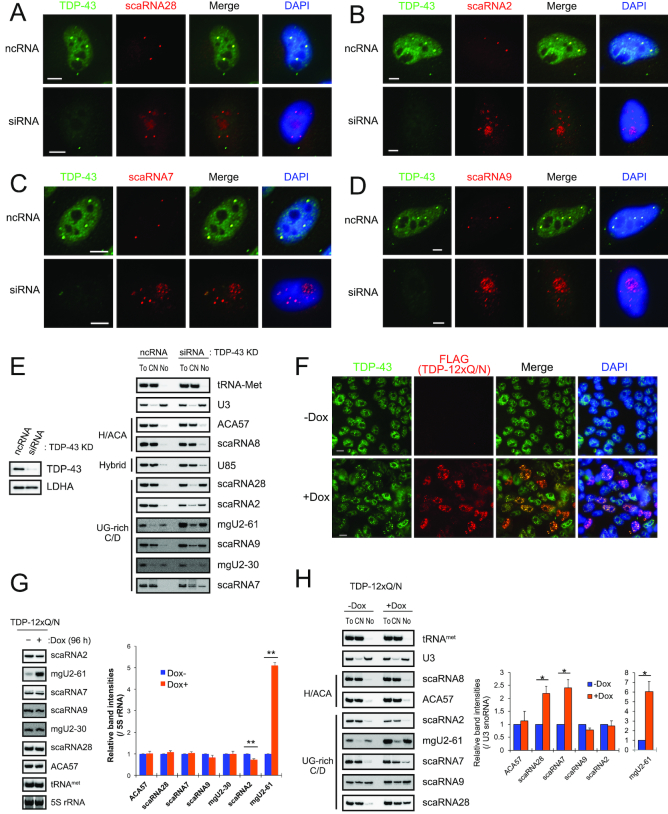
Figure 4.
TDP-43 maintains CB localization of UG-rich motif-bearing C/D scaRNAs. (A–D) FISH analyses for TDP-43 and scaRNA28 (A), scaRNA2 (B), scaRNA7 (C) and scaRNA9 (D) with and without TDP-43 knockdown in HeLa cells. After a 48-h incubation with ncRNA or TDP-43 siRNA, each scaRNA was ectopically expressed for an additional 48 h and detected with Cy3-labeled DNA probes (red). TDP-43 was detected with rabbit polyclonal anti-TDP-43 and FITC-conjugated anti-rabbit IgG (green). Bars indicate 5 μm. FITC and Cy3 signals were merged (Merge); DAPI for DNA staining was overlaid with the merged image. (E) HeLa cells treated for 96 h with ncRNA or TDP-43 siRNA were separated into the cytoplasmic-nucleoplasmic fraction (CN) and the nucleolar fraction (No). RNAs extracted from the CN, No or total cell (To) were detected by northern blot analysis with DNA probes complementary to the RNAs indicated on the right. The extent of TDP-43 knockdown was determined by western blot analysis with antibody against TDP-43 or LDHA (control). (F) Immunocytochemical analysis for TDP-43 and FLAG-TDP-12xQ/N in FLAG-TDP-12xQ/N-expressing T-Rex 293 cells after 96-h treatment of doxycycline. TDP-43 or FLAG-TDP-12xQ/N was detected with rabbit polyclonal anti-TDP-43 and anti-rabbit IgG FITC-conjugated (green), or mouse monoclonal anti-FLAG IgG and anti-mouse IgG Cy3-conjugated antibody (red). Bars indicate 5 μm. FITC and Cy3 signals were merged (Merge); DAPI for DNA staining was overlaid with the merged image. (G) Northern blot analysis of scaRNAs in FLAG-TDP-12xQ/N in FLAG-TDP-12xQ/N-expressing T-Rex 293 cells with (+) or without (-) doxycycline (Dox) treatment. RNAs were detected with DNA probes complementary to the RNAs indicated on the right. The graph shows the band intensities of RNAs for (+) relative to those for (-) detected by northern blot analysis. The band intensity of each of RNAs was normalized with that of 5S rRNA detected with SYBR gold staining. Mean ± SEM, n = 3–4; **P < 0.01, paired t-test. (H) FLAG-TDP-12xQ/N-expressing T-REx 293 cells with (+Dox) or without (-Dox) Dox treatment were separated into the CN and No. RNAs extracted from CN, No or To were detected by northern blot analysis with DNA probes complementary to the RNAs indicated on the right. The graph shows the band intensities of scaRNAs for +Dox relative to those for -Dox in No fractions. The values were normalized with that of U3 (snoRNA). Mean ± SEM, n = 3–4; *P < 0.05, paired t-test.

