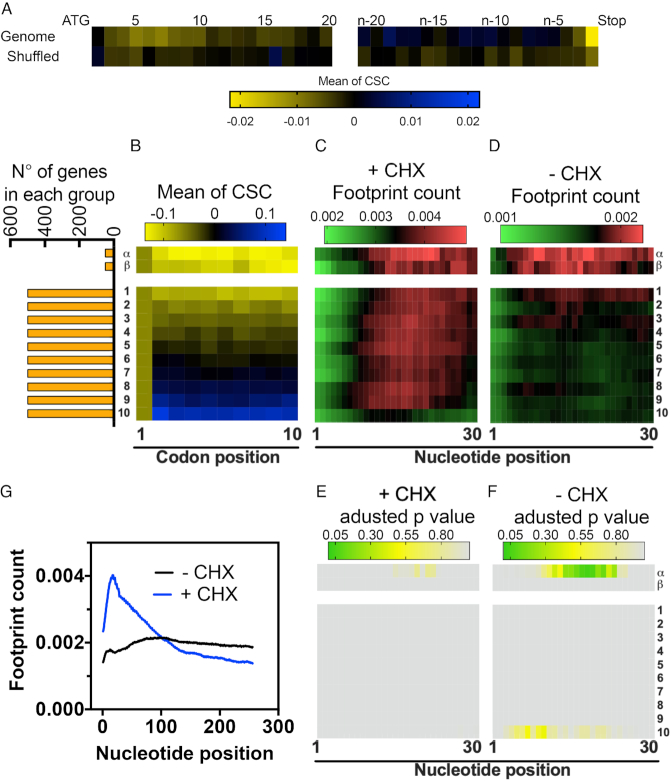
Figure 6.
The enrichment of non-optimal codons near the translation initiation site leads to an increase in ribosome density in a small subset of genes. (A) Average CSC value according to each codon position in the yeast mRNAs. The tile strip on the left represents the first 20 codons, whereas the strip on the right represents the last 20 codons. The heat map shows the mean CSC values ranging from 0.02 to -0.02. A shuffled version of the yeast genome was analyzed as a control. (B) The full yeast genome was subdivided into 10 groups with 500 genes each, organized according to the average CSC of the first 10 codons. The first group (1) contains genes with the lowest average CSC while the last group (10) contains genes with the highest average CSC. The α and β groups are composed of the first 50 sequences with the lowest CSC and the next 50 lowest CSC, respectively. The orange bars show the number of genes in each group. The average ribosome footprint count of each group was derived from experiments performed in the presence (+CHX) (C) or in the absence of cycloheximide (–CHX) (D). For each gene, the number of reads per base was normalized to the total number of reads in a 500-nucleotide window after the ATG of the same gene. The variations in footprint count for each of the groups shown in panels C and D were analyzed by multiple t-tests using the Holm–Sidak method; the adjusted P-values are shown using a heat map in panels (E) and (F), respectively. Panel (G) shows the normalized average ribosome footprint counts for all yeast genes in the presence or absence of CHX.

