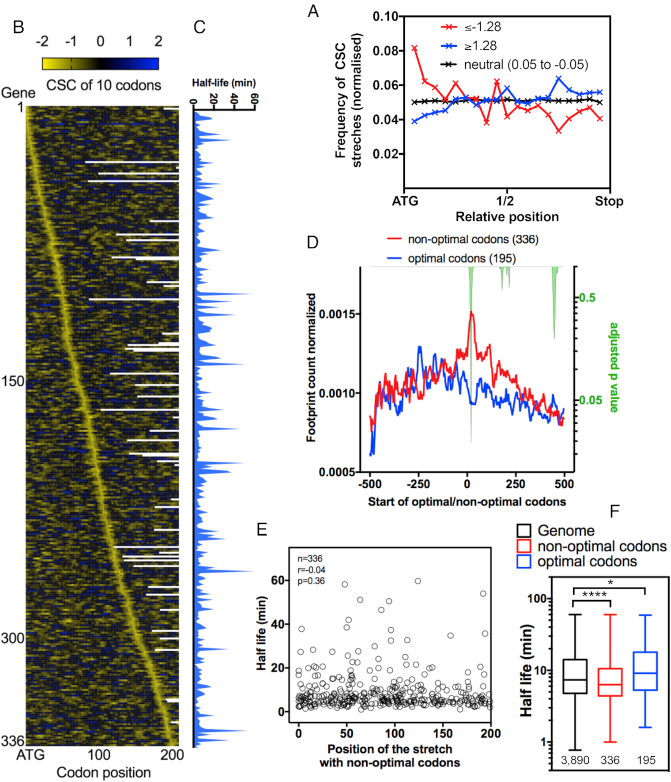
Figure 7.
Occurrence and position of non-optimal/optimal codon stretches in yeast mRNAs and their impact on translation. (A) The frequency of stretches of 10 consecutive codons with extremely low CSC values (≤–1.28) (red line) across the mRNA sequence. Neutral stretches (0.05 ≥ CSC ≥ –0.05, black line) and optimal stretches of CSCs (≥1.28) (blue line) were used as the control groups. Dunn's multiple test comparisons; **** ≤–1.28 versus neutral (0.05 to –0.05), **** ≤–1.28 versus ≥1.28 and **** ≥1.28 versus neutral (0.05 to –0.05). See details of the statistical analysis in Supplementary Table S7A. (B) mRNA sequences containing a 10-codon stretch with CSC values ≤–1.28 were aligned according to the position of the non-optimal stretch from the start codon. The heatmap depicts the sum of the CSC values in a ten-codon window. Panel (C) shows the mRNA half-lives (11) of the genes presented in panel 7B. (D) The average ribosome footprint density of the genes presented in panel 7C from the stretch of non-optimal codons (position 0). The number of reads at each position was normalized to the total number of reads in a 500-nucleotide window before and after the stretch. Genes with optimal stretches of CSC (≥1.28) (blue line) were used as the control group. The right y-axis represents the adjusted p-value (green area) calculated for each nucleotide position by multiple t-tests using the Holm-Sidak method. (E) The mRNA half-life values (11) were plotted according to the position of the non-optimal codon stretch (CSC ≤ –1.28) from the ATG. No correlation was found between the non-optimal codon position and the mRNA half-life. (F) The half-life (11) of the gene categories used in panels A and D. Kruskal–Wallis test, ****<0.0001, *0.017.

