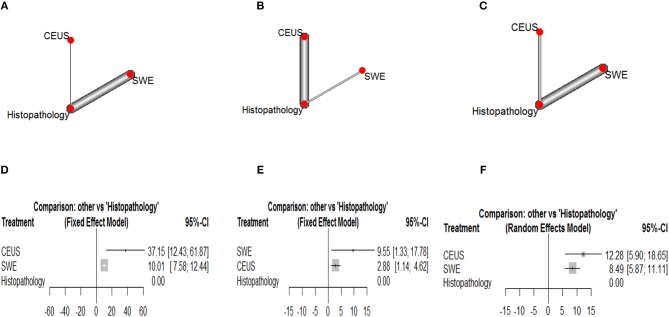
Figure 6.
Network plots showing direct evidence between Contrast Enhanced Ultrasound and Shear Weight Elastography in (A) breast cancer, (B) hepatic caner, and (C) thyroid cancer. Also, forest plots of network meta-analysis between Contrast Enhanced Ultrasound and Shear Weight Elastography vs. histopathology in (A) breast cancer, (B) hepatic caner, and (C) thyroid cancer. (D) Forest plot CEUS vs. SWE of breast cancer. (E) Forest plot CEUS vs. SWE of hepatic cancer. (F) Forest plot CEUS vs. SWE of thyroid cancer.

