Figure 1.
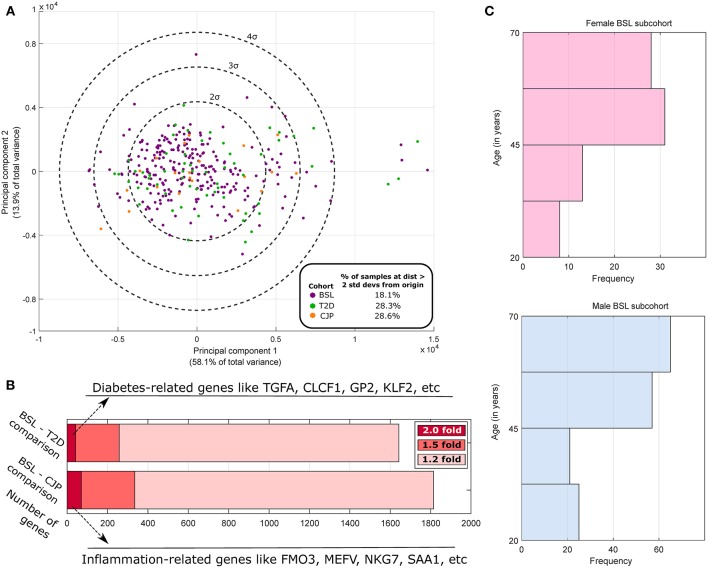
Population analysis of GTEx human tibial nerve samples. (A) PCA of the gene expression profile across all three cohorts of highly variable genes and subsequent plotting of the top 2 principal components show a larger fraction of outlier samples in CJP and T2D with respect to BSL. (B) The number of genes that are DE at 1.2-fold, 1.5-fold, and 2-fold when comparing the BSL with CJP and T2D are shown, along with some of the strongest DE genes. (C) The histogram of age in male and female BSL subcohorts show a similar distribution.

