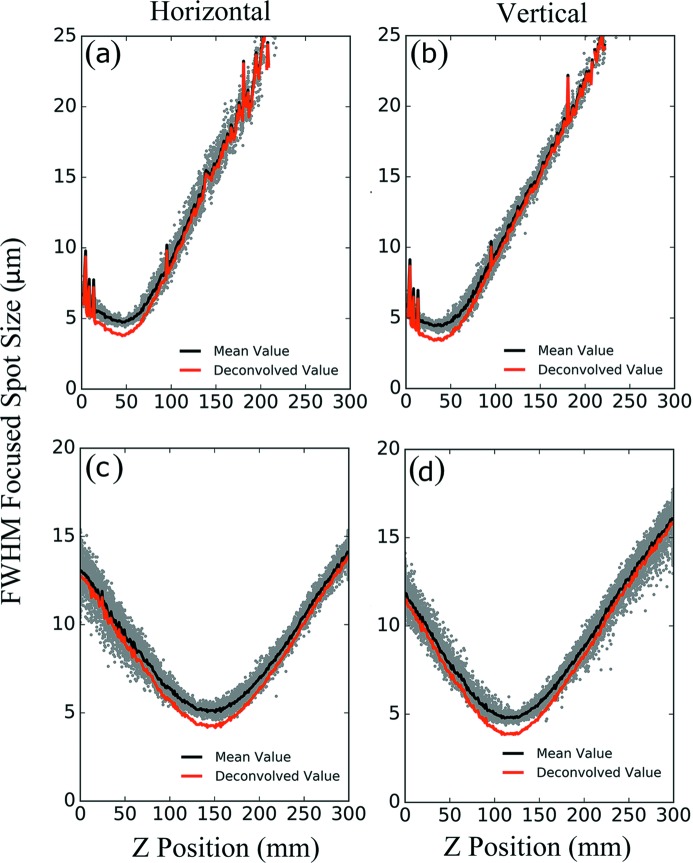
Figure 6.
Focused beam profile characterization at 9.5 keV. The upper row represents no pre-focusing and the lower row represents pre-focusing using the lenses in the XRT. Each of the gray dots in the horizontal and vertical direction represents an LCLS shot to which a two-dimensional Gaussian profile was fitted to the measured profile. The solid black lines in (a), (b), (c) and (d) represent the average of the fitted spots within certain central transfocator Z position bin. (a) Results of horizontal spatial beam profile characterization without pre-focusing. (b) Results of vertical spatial beam profile of focused beam without pre-focusing. The focused beam spot size is ∼3.7 µm. The results show an astigmatic beam profile potentially due to misaligned lenses or a bending in the HOMS. (c) Results of horizontal spatial beam profile characterization with pre-focusing. (d) Results of vertical spatial beam profile characterization with pre-focusing. The results also show an obvious astigmatic beam profile possibly from misaligned (e.g. rotated) pre-focusing lenses.

