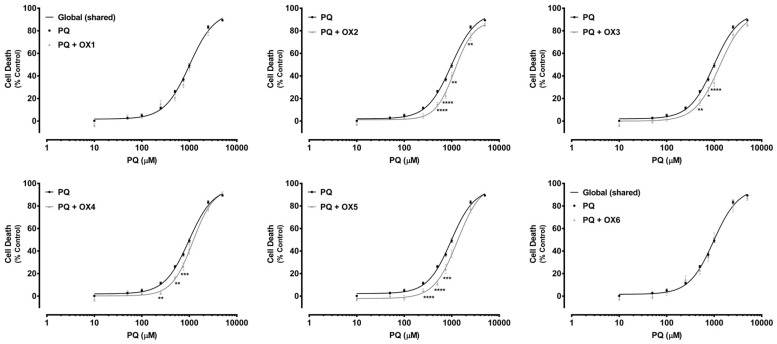
Figure 6.
Paraquat (PQ) concentration—response (cell death) curves obtained in the absence (PQ curve) or in the presence of the six tested oxygenated xanthones (20.0 μM) (PQ + OX 1–6 curves). Results are presented as mean ± SEM from four independent experiments (performed in triplicate). Concentration—response curves were fitted using least squares as the fitting method and the comparisons between PQ and PQ + OX 1–6 curves (LOG EC50, TOP, BOTTOM, and Hill Slope) were made using the extra sum-of-squares F test. Statistical comparisons were made using two-way ANOVA, followed by the Sidak’s multiple comparisons post hoc test (* p < 0.05; ** p < 0.01; *** p < 0.001; **** p < 0.0001 PQ + OXs vs. PQ). In all cases, p values < 0.05 were considered statistically significant.

