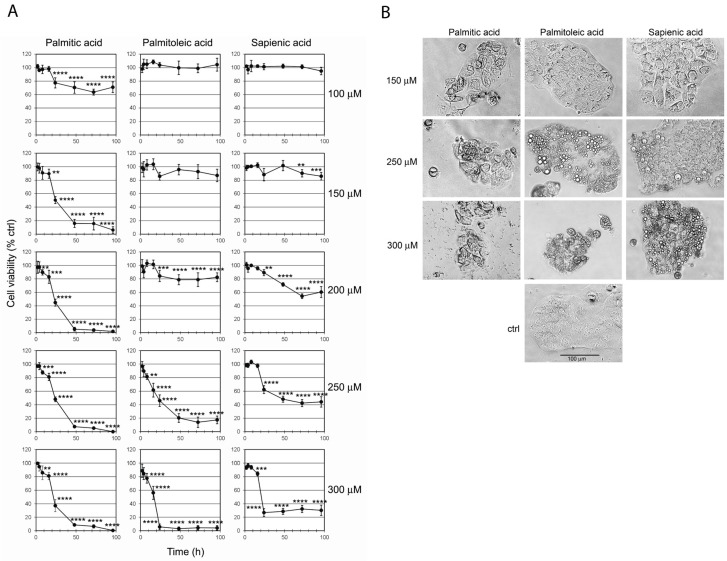
Figure 2.
(A) Effect of fatty acid supplementation on Caco-2 cell viability expressed as relative percentages compared to control cells without supplementation. Cell viability was evaluated by a colorimetric assay based on MTS reduction. Cells were exposed for different times to the indicated concentrations of palmitic, palmitoleic or sapienic acids. Results are means ± SD of three different experiments, expressing the percentage of viability compared to control cultures. Values of SD never exceeded 15%. Data were analysed by an ANOVA/Bonferroni test, followed by a comparison with Dunnett’s test (confidence range 95%; * p < 0.05, ** p < 0.01, *** p < 0.001, **** p ≤ 0.0001 versus untreated cells). (B) Appearance of Caco-2 cells supplemented with different fatty acid concentrations for 24 h. Cell morphology was assessed by phase contrast microscopy after the exposure to the indicated concentrations of the three fatty acids. The cell morphology of control cells is also shown. Magnification 200×.

