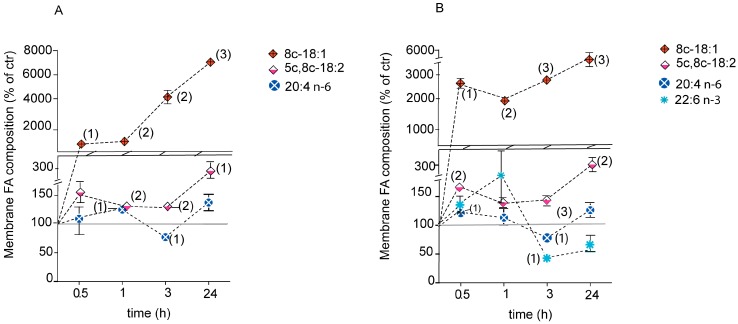
Figure 4.
Time monitoring of significant MUFA and PUFA changes in membrane fatty acids of Caco-2 cells (reported as % of controls) treated with sapienic acid. (A) 150 µM and (B) 300 µM. The corresponding quantitative values are reported in Supplementary Information (Tables S3, S4 and S7). The grey bar indicates the values of control cells. Numbers in parenthesis indicate the statistical significance value: (1) p ≤ 0.047; (2) p ≤ 0.0097; (3) p ≤ 0.0009 for (A); (1) p ≤ 0.0485, (2) p ≤ 0.0073, (3) p ≤ 0.0009 for (B).

