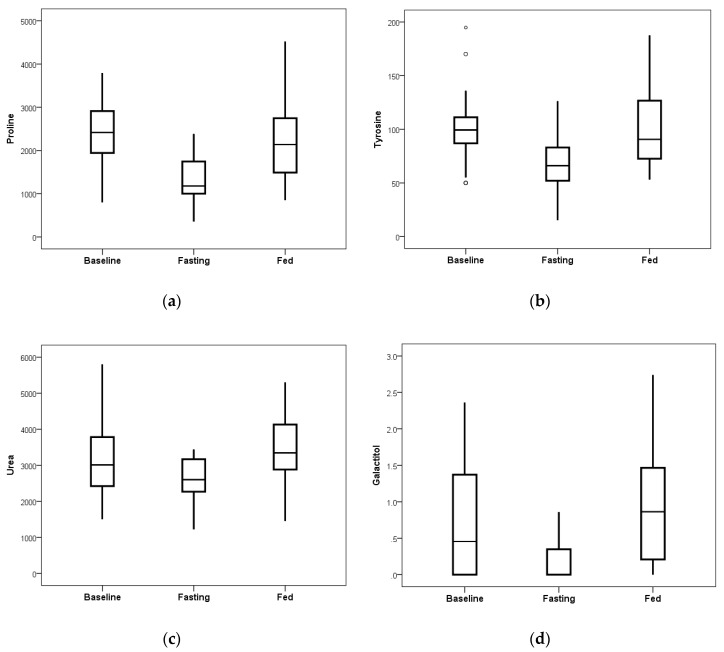
Figure 5.
After 24 h of the fasting intervention, reductions were noted in proline, tyrosine, urea, and galactitol as compared to the observed changes on the ad libitum fed day that were statistically significant when corrected for the 74 comparisons. (a) Proline achieved p = 0.00002. (b) Tyrosine achieved p = 0.00033. (c) Urea achieved p = 0.00034. (d) Galactitol achieved p = 0.00058. Displayed values are relative measures of each metabolite compared to the internal d4-succinate standard. The bottom of the box is the 25th percentile and the top is the 75th percentile of data, while the whiskers extend up to 1.5 times beyond the height of the box (if data points exist within that interval). Open circles represent outliers that are more than 3-fold greater or less than the height of the box (see panel b where most baseline values were tightly clustered in a small interval but three values were quite divergent).

