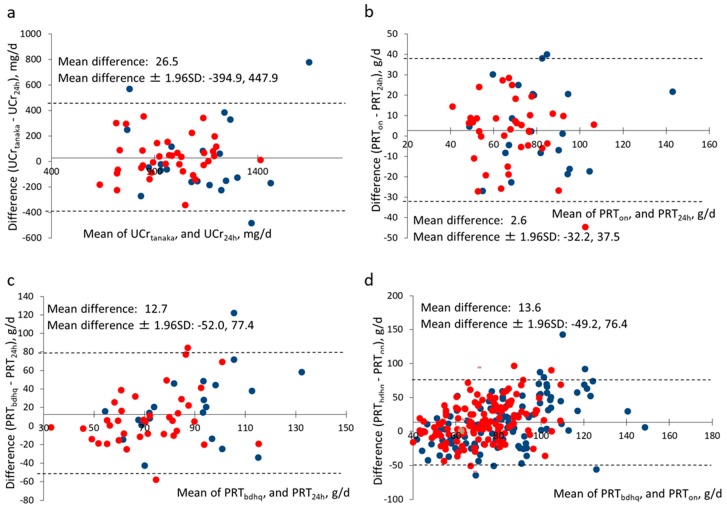
Figure 1.
Bland–Altman plots. Estimates were compared with references; horizontal axes correspond to means of estimates and standards, and vertical axes correspond to differences [estimates − standards]. Solid horizontal axes are placed at the mean differences, and dashed lines correspond to the mean ± 1.96 × SD. Blue “●” and red “●” circles indicate male and female subjects, respectively. Estimates and references in each panel are (a) daily creatinine excretion estimated by Tanaka’s equation (UCrtanaka) and measured in 24-h urine (UCr24h; N = 58), (b) protein intake estimated from biomarkers measured in overnight urine (PRTon) and 24-h urine (PRT24h; N = 58), (c) protein intake estimated from the brief-type self-administered diet history questionnaire (BDHQ; PRTbdhq) and PRT24h (N = 58), and (d) protein intake estimated from the BDHQ (PRTbdhq) and PRTon (N = 248).

