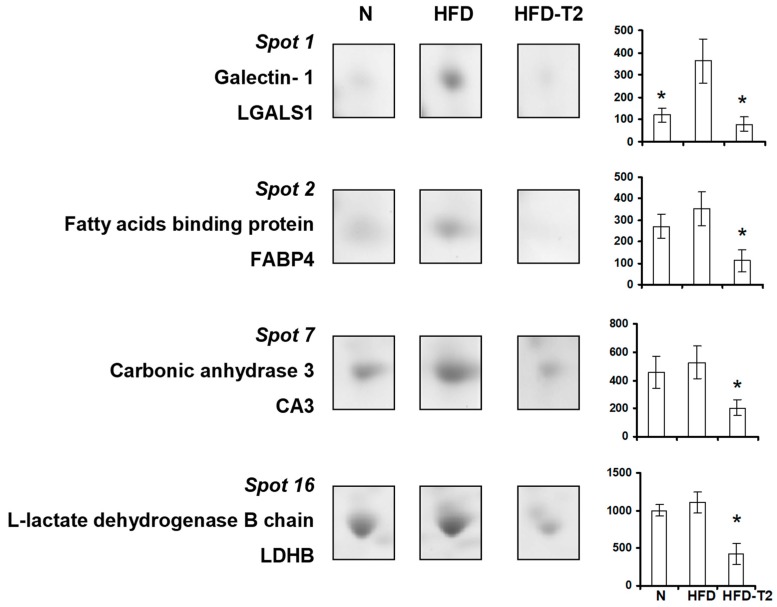
Figure 6.
Four-week 3,5-T2 treatment-associated differential representation within the VAT proteome with regard to metabolically relevant proteins. Representative subsections of 2D-E images of VAT of N, HFD, HFD-T2 rats. Results are expressed as arbitrary units (means ± SEM; n = 4). * p < 0.05 vs. HFD. Spot numbering refers to Figure 5a.

