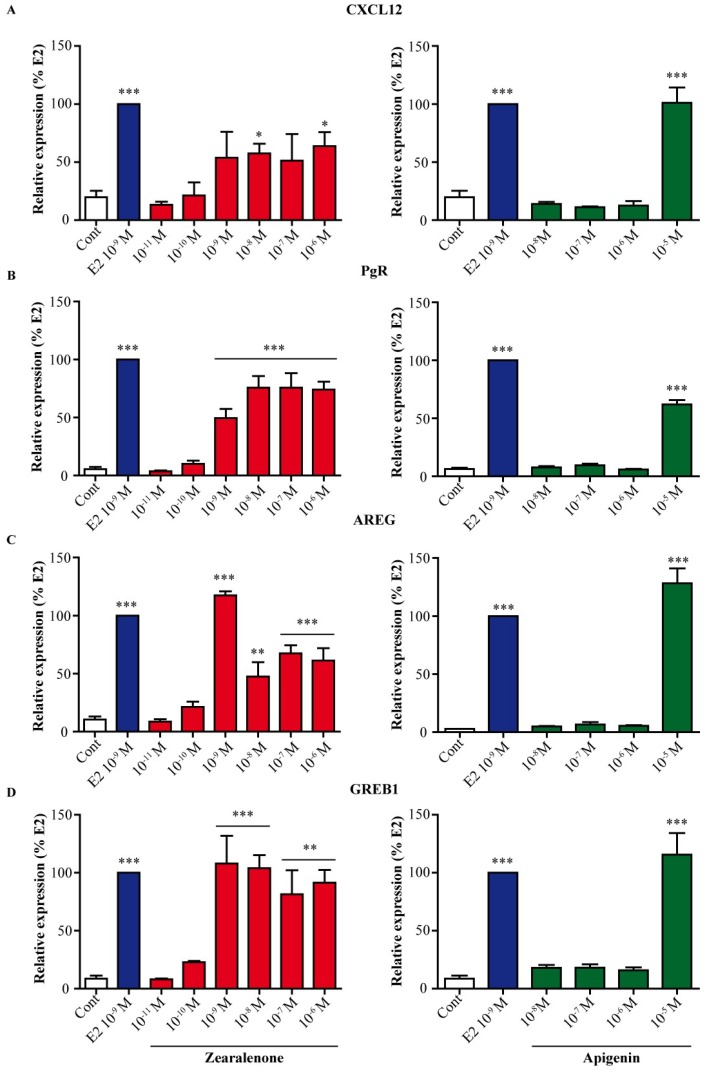
Figure 3.
Effect of zearalenone and apigenin on the expression of endogenous E2 target genes. MCF-7 cells were treated with solvent (white) as a negative control, 10−9 M E2 (blue) as a positive control or with various doses of zearalenone (red) or apigenin (green) for 24 h. The expression of CXCL12 (A), PgR (B), AREG (C) and GREB1 (D) was assessed by real-time PCR. The expression level of each gene was normalized to the expression levels of the housekeeping genes GAPDH and TBP. The results are expressed as the percentage of the relative expression of transcripts obtained in E2-treated cells and are the means ± SEM of three independent experiments. * indicates a p-value < 0.05, ** indicates a p-value < 0.01, and *** indicates a p-value < 0.001 by one-way ANOVA followed by Dunnett’s post hoc test for comparison of the control treatment with the other treatments.

