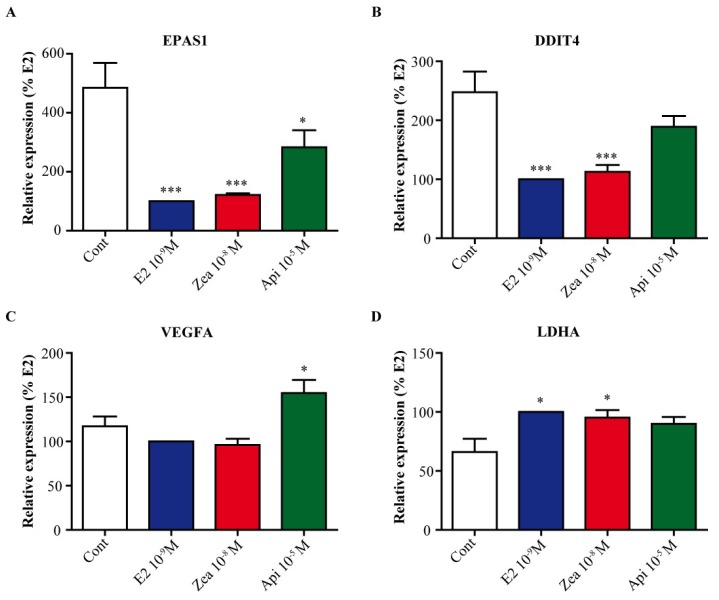
Figure 8.
Validation of metabolism and growth arrest genes linked to HIF1α and EPAS1/HIF2α.MCF-7 cells were treated with solvent (white) as a negative control, 10−9 M E2 (blue) as a positive control, 10−8 M zearalenone (red) or 10−5 M apigenin (green) for 24 h. The expression of EPAS1/HIF2α (A), DNA damage inducible transcript 4 (DDIT4) (B), vascular endothelial growth factor A (VEGFA) (C) and lactate dehydrogenase A (LDHA) (D) was assessed by real-time PCR. The expression level of each gene was normalized to the expression levels of the housekeeping genes GAPDH and TBP. The results are expressed as the percentage of the relative expression of transcripts obtained in E2-treated cells and are the means ± SEM of six independent experiments. * indicates a p-value < 0.05 and *** indicates a p-value < 0.001 by one-way ANOVA followed by Dunnett’s post hoc test for comparison of the control treatment with the other treatments.

