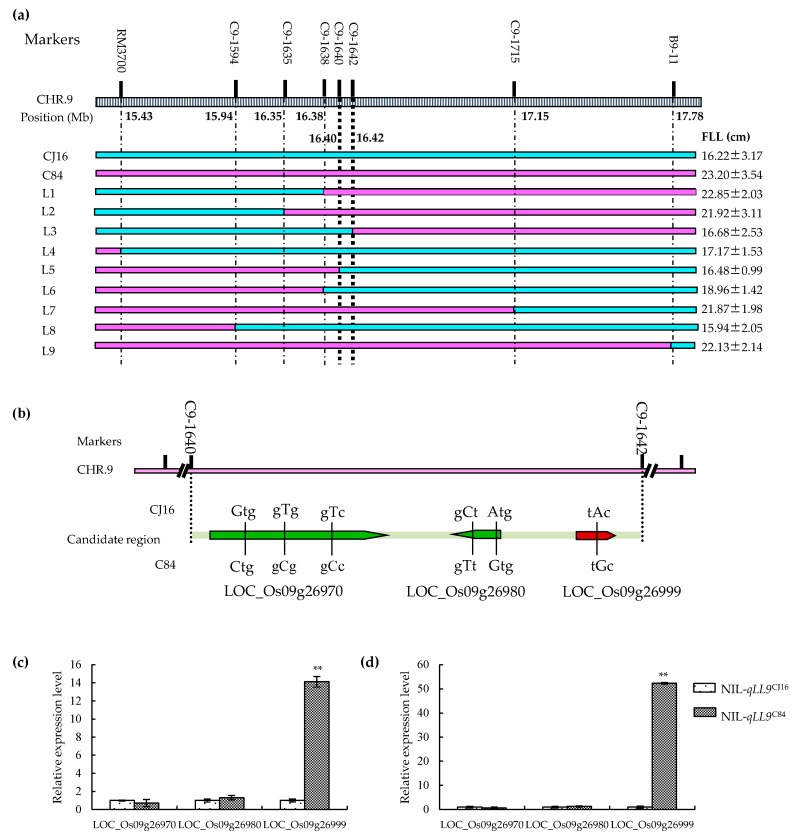
Figure 4.
Map-based cloning of qLL9 and expression analysis of candidate genes. (a) High-resolution mapping of qLL9. Numbers on the map indicate the physical distance on chromosome 9. Nine recombinant plants were used to refine the candidate region to 16.17 kb region by substitution mapping, in which green and pink rectangles indicate the homozygous CJ16 genotype and homozygous C84 genotype, respectively. Flag leaf length (FLL) values were obtained from the corresponding selfed progenies and represented as mean ± SD (n = 12). (b) Predicted open reading frames and sequence difference of the qLL9 between CJ16 and C84 are shown. Relative expression of three candidate genes LOC_09g26970, LOC_09g26980, and LOC_09g26999 of near isogenic line (NIL)-qLL9CJ16 and NIL-qLL9C84 at tillering stage (c) and heading stage (d) by quantitative real-time polymerase chain reaction (qRT-PCR). Data are mean ± SD (n = 3). Asterisks represent significant difference determined by Student’s t-test at p-value < 0.01 (**).

