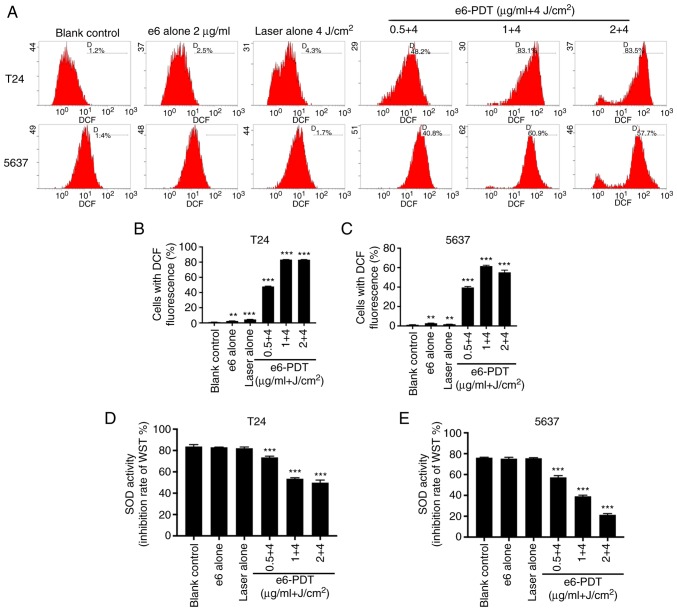
Figure 7.
Detection of ROS and SOD in bladder cancer cells following e6-PDT. (A) DCFH-DA reagent was used to measure the production of intracellular ROS following e6-PDT. Cells with DCF fluorescence were examined with flow cytometry. (B and C) Quantification of ROS generated in T24 and 5637 cells (n=3). (D and E) SOD activity of T24 and 5637 cells following e6-PDT was determined using a SOD Assay Kit-WST (n=3). The inhibition rate of WST reflects the activity of SOD. **P<0.01 and ***P<0.001 vs. blank control group. ROS, reactive oxygen species; SOD, superoxide dismutase; e6-PDT, chlorophyllin e6-mediated photodynamic therapy; DCFH-DA, 2′,7′-dichlorofluorescein diacetate; WST, Water-Soluble Tetrazolium.

