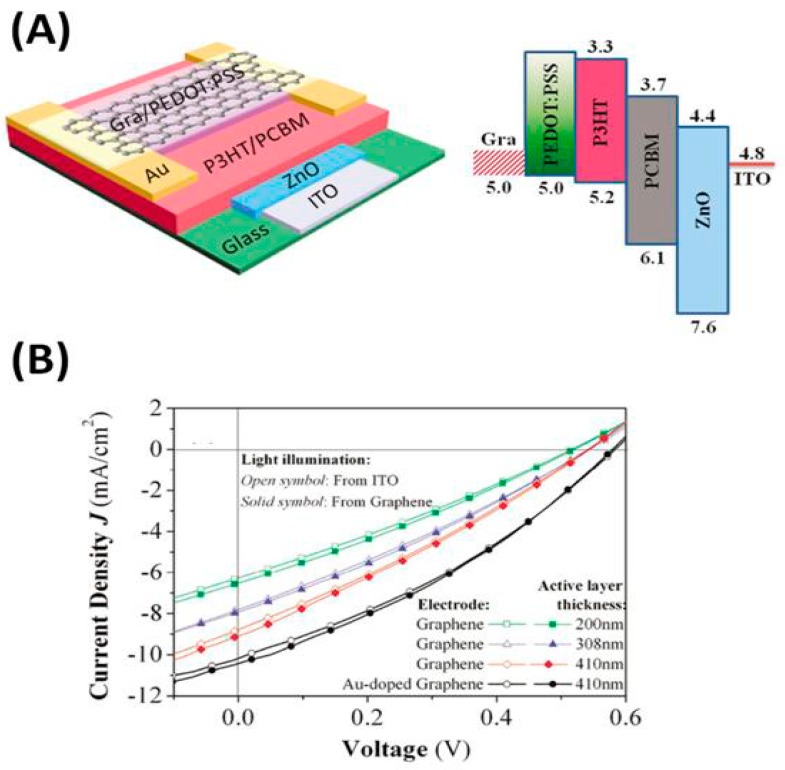
Figure 23.
(A) Schematic representation and band structure of a PSC with the structure Glass/ITO/ ZnO/P3HT:PCBM/Au/PEDOT:PSS/G; (B) J–V characteristics measured from two sides of the PSC with G top electrode and different active layer thicknesses. Reproduced with permission from [137].

