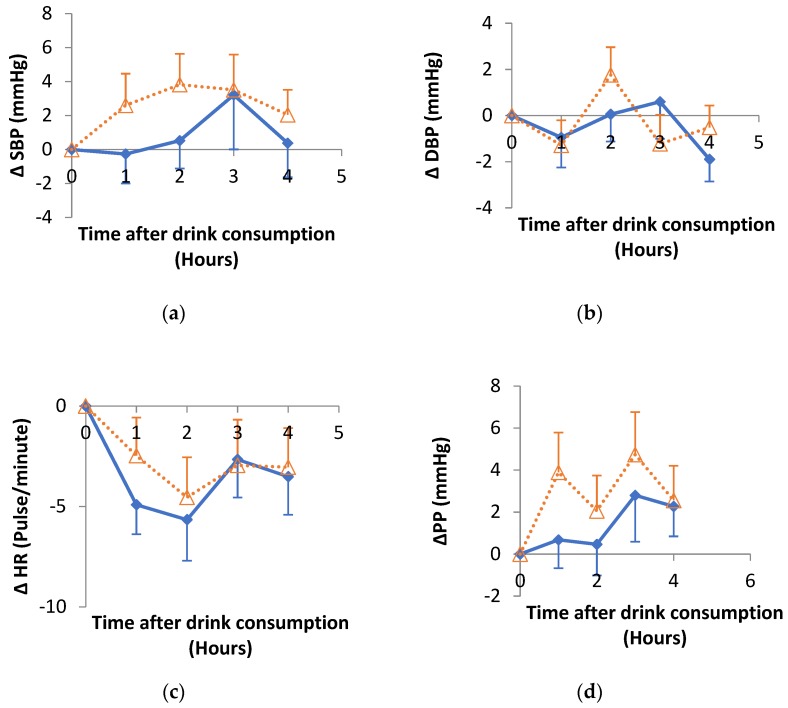
Figure 3.
Changes in (a) systolic blood pressure (SBP), (b) diastolic blood pressure (DBP), (c) heart rate (HR), (d) pulse pressure (PP), after hibiscus drink (solid lines) or water consumption (dotted lines) relative to baseline. There were no significant differences between hibiscus and water groups in each case. Δ means change in.

