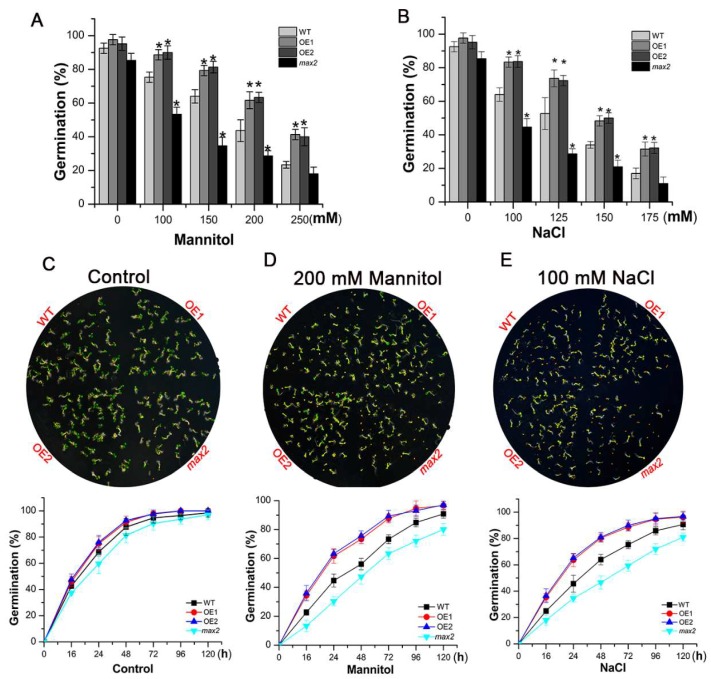
Figure 6.
SsMAX2 OE lines exhibited higher salt and osmotic stress tolerance during the seed germination stage. (A,B) Seed germination rate of the SsMAX2 OE lines, max2, and WT under various concentrations of NaCl and mannitol treatment; (C–E) Time-course assay of the seed germination of different lines under 200 mM mannitol and 100 mM NaCl treatment. Data are presented as means ± SD of three biological replicates. Significant differences between WT and the other groups were determined by Student’s t-test. Significance level: * p < 0.05.

