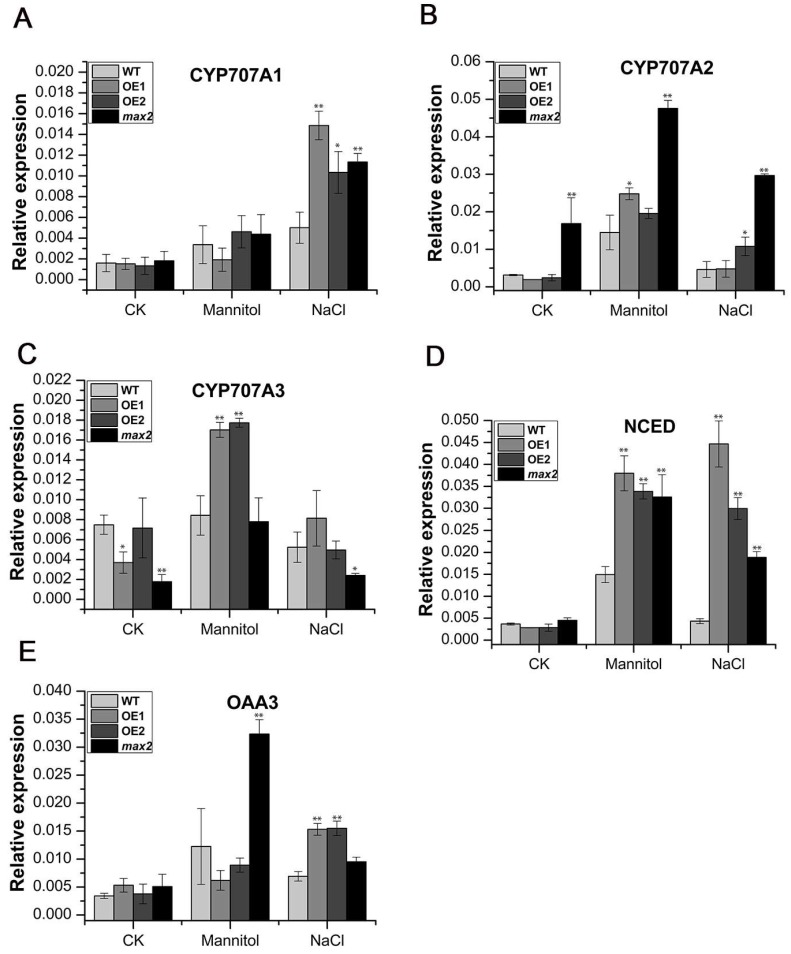
Figure 9.
Expression of key ABA biosynthesis genes of the SsMAX2 OE lines, max2, and WT was diversely regulated in response to salt and osmotic treatment. The gene expression of (A) CYP707A1, (B) CYP707A2, (C) CYP707A3, (D) NCED3, and (E) OAA3 was determined at 6 h after mannitol and NaCl treatment by qPCR. SsACT was used as the internal control. Data are presented as means ± SD of three biological replicates. Student’s t-test was used to determine the significant differences between WT and other Arabidopsis lines. Significance level: * p < 0.05, ** p < 0.01.

