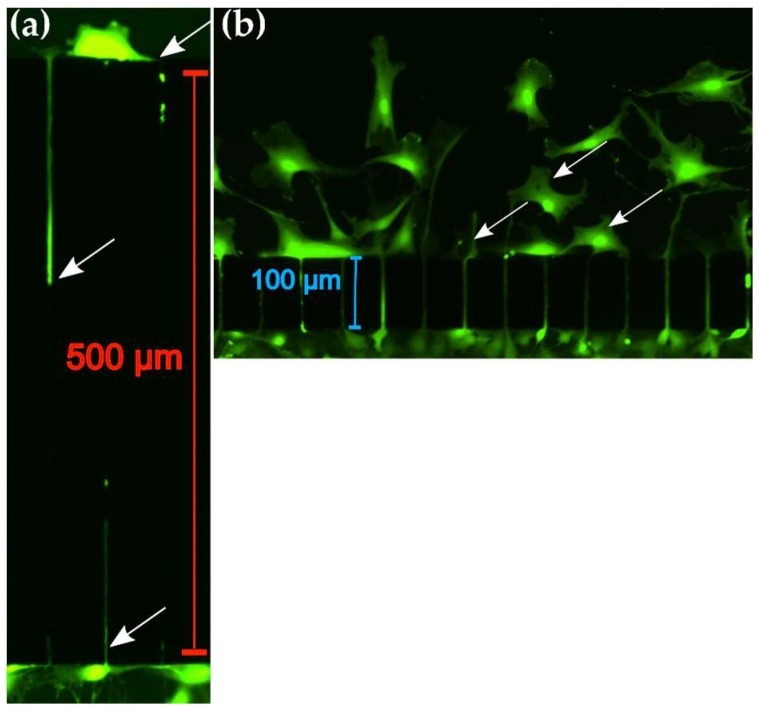
Figure 6.
Effect of microchannel length on primary myoblast migration behavior. (a) Representative fluorescent image of cells crossing 500 μm length (width = 5 μm) microchannel from the proximal (bottom) to distal chamber (top). Arrows indicate cytoplasmic structures of cells in the microchannels. (b) Representative fluorescent image of cells crossing 100 μm length microchannel (width = 5 μm) from proximal (bottom) to distal (top) chamber. Arrows indicate cytoplasm structures after release of confinement from the microchannels.

