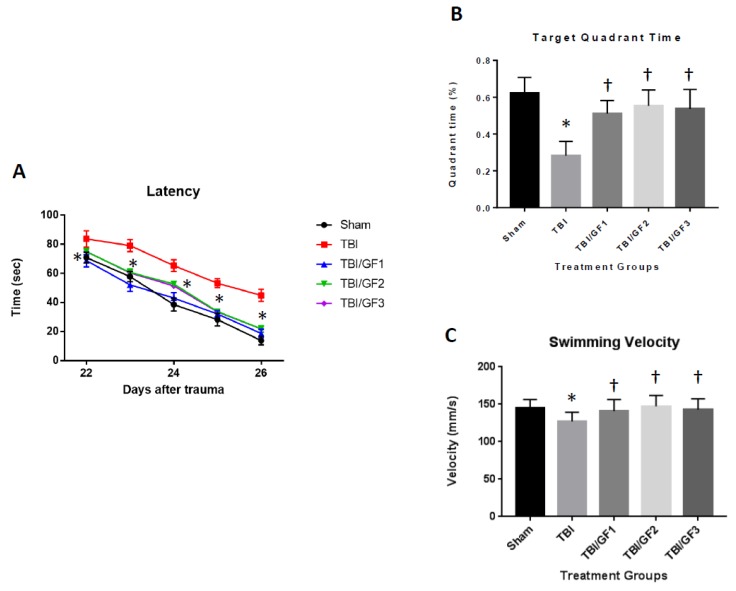
Figure 2.
Effects of GF diets on Morris water maze testing. (A) Latency, (B) time in target quadrant, and (C) swimming velocity in sham, TBI and TBI + diet mice. Mice were subjected to the Morris water maze and examined for the time to find the platform and the time spent in the target quadrant. No difference was detected in the swimming velocity. Data are expressed as the mean +/− SD (n = 10, A = * p < 0.001 compared to TBI group; B/C = * p < 0.001 compared to sham group, † p < 0.001 compared to TBI group).

