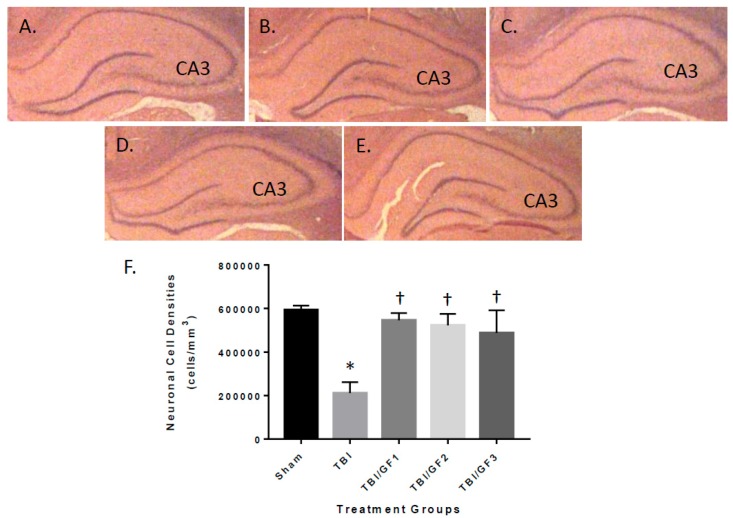
Figure 5.
TBI-mediated reduction in hippocampal neuronal densities. (A–E) Brains of mice were analyzed in previous studies were evaluated at the end of the study for neuronal densities in the CA3 region of the hippocampus. (A) Sham; (B) TBI; (C) TBI + GF1; (D) TBI + GF2; and (E) TBI + GF3. (F) Regions were analyzed by quantitative histology to determine the brain lesion volume at the impact site. The number of neuronal cells/mm3 was determined in each of the mouse groups. The results are expressed as mean +/- SD (n = 10, * p < 0.001 compared to the sham group; † p < 0.001 compared to the TBI group).

