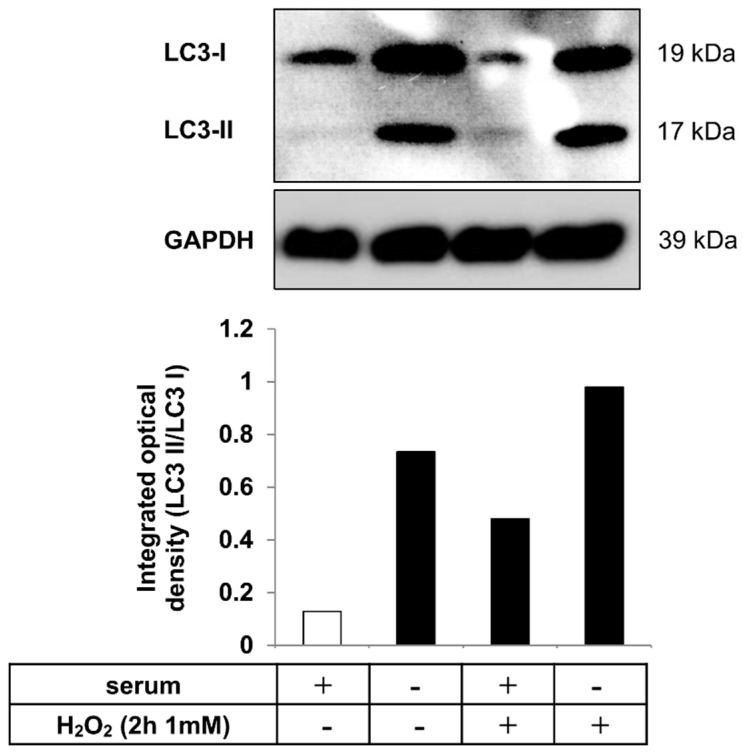
Figure 3.
Autophagy induction as a result of serum deprivation and H2O2 co-treatment in hESC-RPE cells. Representative western blot image for the expression of LC3 in hESC-RPE cells treated with 1 mM H2O2 for 2 h in the presence or absence of serum. Integrated optical density was determined by densitometry for quantification of the LC3-II/LC3-I ratio using the ImageJ software. GAPDH was used as a loading control. Data are representative of three independent experiments.

