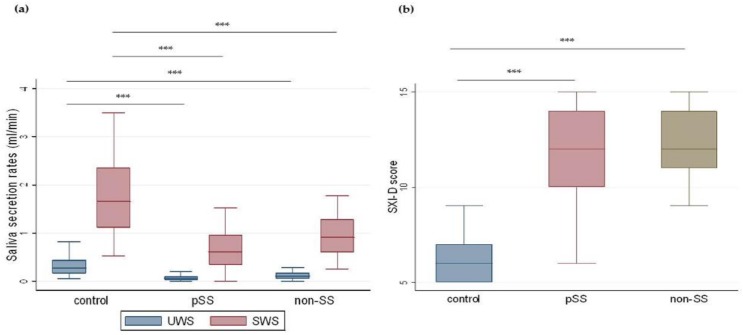
Figure 3.
Measured saliva secretory rate and self-reported perception of xerostomia in the three groups. Boxplots illustrate median, IQRs, and ranges of (a) saliva secretion rates (mL/min) and (b) SXI-D: Summated Xerostomia Inventory-Dutch scores in controls, primary Sjögren’s patients (pSS), and non-Sjögren’s sicca patients (non-SS). (Kruskal–Wallis ANOVA and Mann–Whitney U test; *** p < 0.001.)

