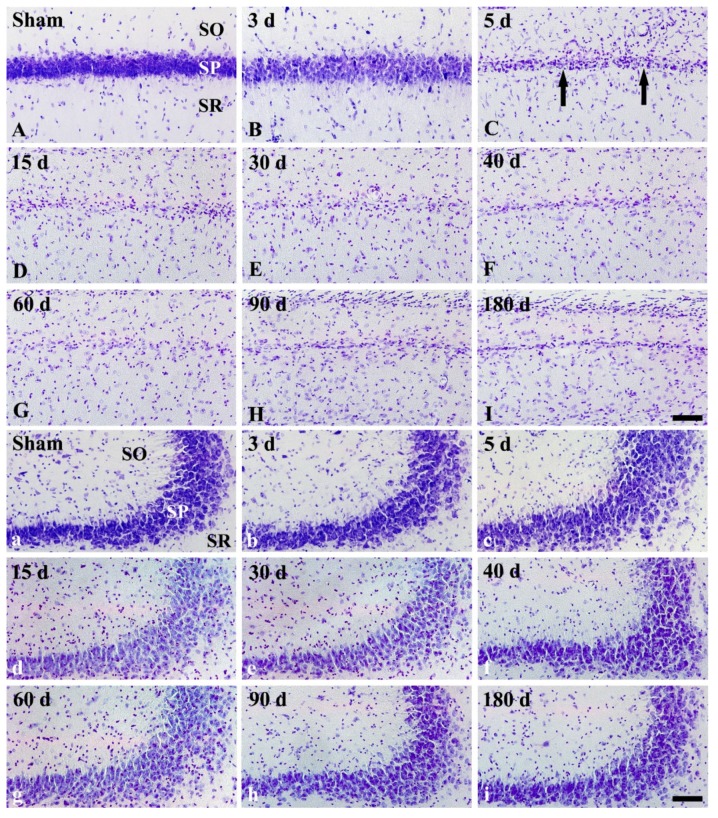
Figure 2.
High magnification of CV staining of CA1 (A–I) and CA2/3 (a–i) of the sham operated (A,a) and ischemia operated (B–I, b–i) groups after tgCI. In the CA1, CV stained cells were hardly shown in the stratum pyramidale (SP, arrows) from 5 days after tgCI. In the CA2/3, CV+ cells in the SP are slightly pale from 15 days after tgCI compared to those in the sham operated group. SO, stratum oriens; SR, stratum radiatum. Scale bar = 50 μm.

