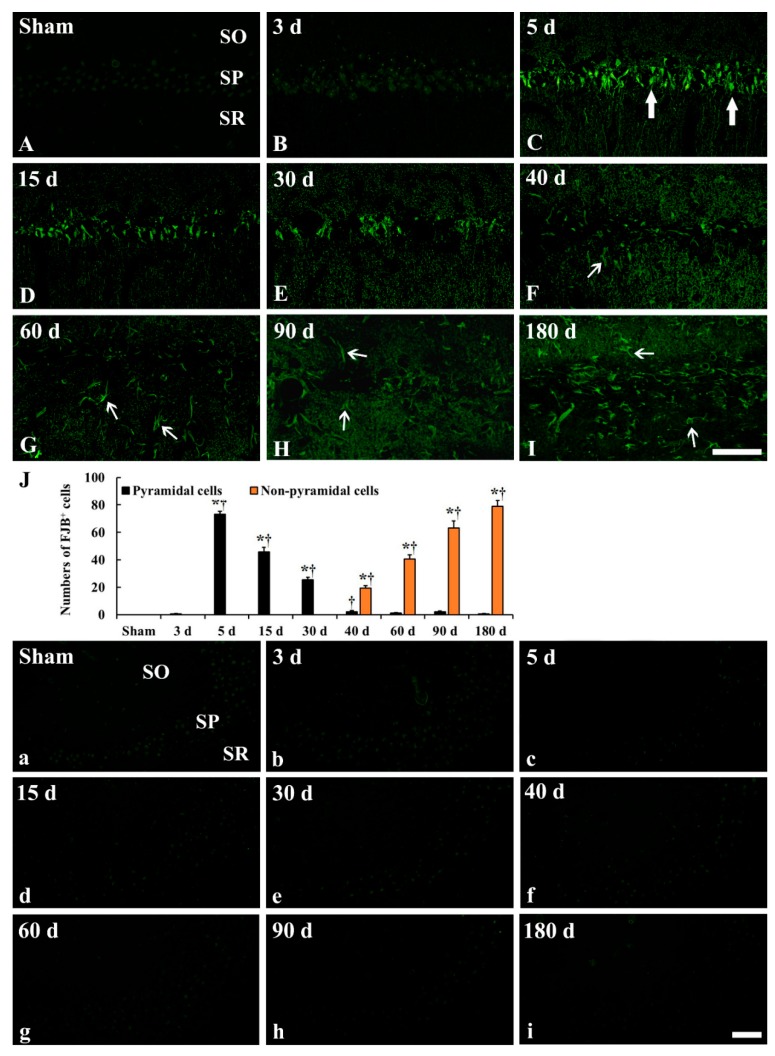
Figure 3.
Fluoro-Jade B (FJB) fluorescence staining in the CA1 (A–I) and CA2/3 (a–i) of the sham operated (A,a) and ischemia operated (B–I, b–i) groups after tgCI. In the CA1, FJB+ pyramidal cells (large arrows) are shown in the stratum pyramidale (SP) from 5 to 30 days after tgCI. In addition, many FJB+ cells (small arrows) are detected in the stratum oriens (SO) and radiatum (SR) from 40 to 180 days after tgCI. In the CA2/3, FJB+ cells are not shown at any time after tgCI. Scale bar = 50 μm. (J) Numbers of FJB+ pyramidal (black) and non-pyramidal (yellow) cells in the CA1 (n = 7; * p < 0.05 vs. sham operated group, † p < 0.05 vs. pre-time point group). The bars indicate the means ± SEM.

