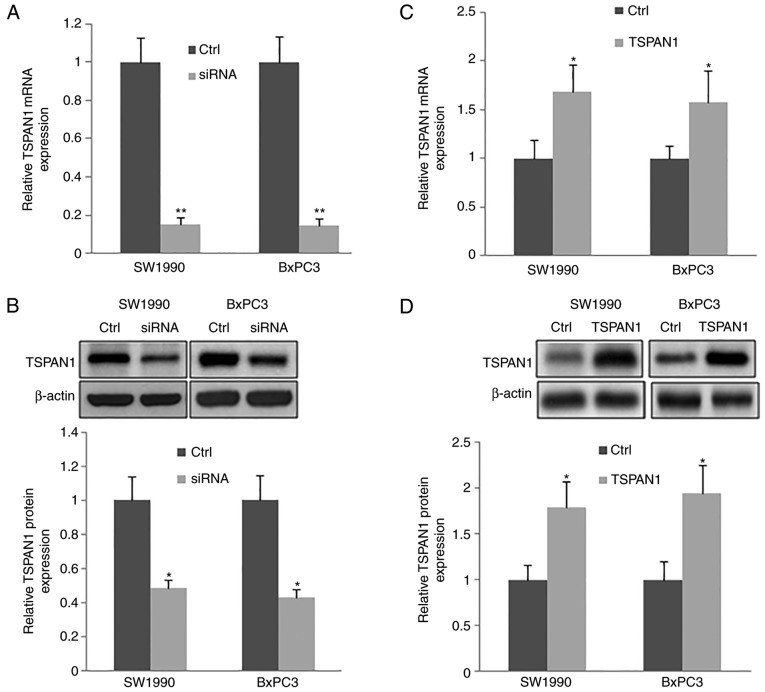
Figure 2.
Successful transfection of siTSPAN1 and pLNCX-TSPAN1-cDNA plasmid into SW1990 and BxPC3 cell lines and analysis of the transfection effects. (A) siRNA targeted to TSPAN1 was transfected into SW1990 and BxPC3 cells (siRNA group); Scrambled siRNA-transfected cells were used as control (Ctrl). RT-qPCR was performed to analyze the mRNA levels of TSPAN1. (B) Western blot analysis was performed to detect the protein level of TSPAN1 following TSPAN1-siRNAs transfection (upper panel) and was subsequently quantified (lower panel). (C) The pLNCX-TSPAN1-cDNA recombinant plasmid was transfected into SW1990 and BxPC3 cells (TSPAN1 group), and plasmid pLNCX was transfected into SW1990 and BxPC3 cells as the control group (Ctrl). The mRNA levels of TSPAN1 were analyzed via RT-qPCR. (D) The protein levels of TSPAN1 were detected using western blottingfollowingpLNCX-TSPAN1-cDNA transfection (upper panel) and then quantified (lower panel). *P<0.05 and **P<0.01 vs. Ctrl (n=3). TSPAN1, Tetraspanin 1; RT-qPCR, reverse transcription-quantitative polymerase chain reaction; siRNA, small interfering RNA; Ctrl, control.

