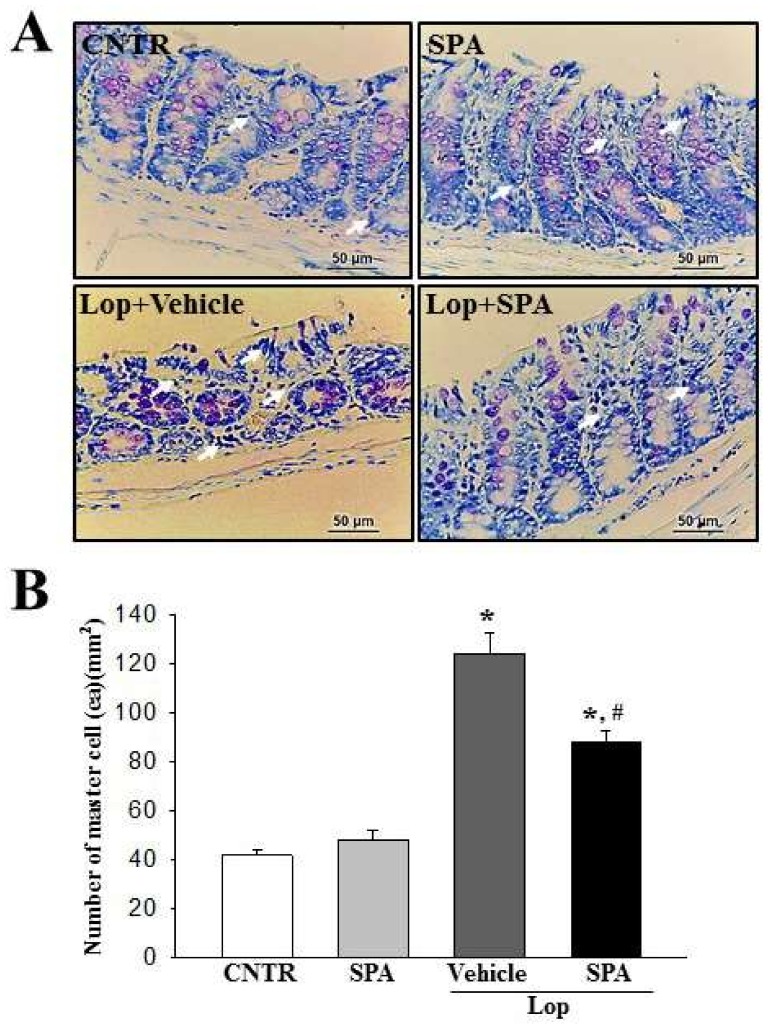
Figure 5.
The levels of mast cell infiltration after SPA administration: (A) Colon tissue stained with toluidine blue. The infiltration of mast cells (arrows) was identified in the slide sections of the colon tissue by staining with toluidine blue followed by observation at 400× magnification. (B) Number of mast cells. Five to six rats per group were used in the toluidine blue analysis, and the cell number was measured in duplicate in three different slides. The data are reported as the mean ± SD. * indicates p < 0.05 compared to the CNTR group. # indicates p < 0.05 compared to the Lop + Vehicle-treated group.

