
Figure 5.
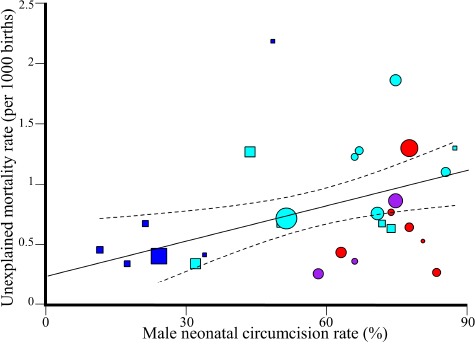
Weighted regression analysis of unexplained male mortality and US MNC rates. The 95% confidence intervals of the best fit line are denoted in dashed lines. Color codes are as in Figure 2. Symbols mark states where Medicaid, the leading insurance company in US, covers (circles) or does not cover (squars) MNC.