Figure 2.

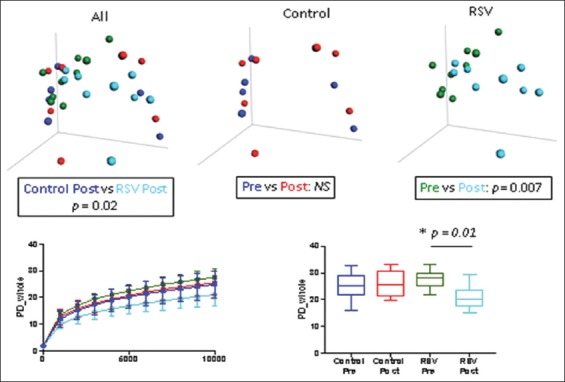
Differences in fecal microbiota between the resveratrol (RES) and placebo-control total subject groups. Upper panels: β-diversity as determined by unweighted UniFrac analysis; Lower panels: Differences in α-diversity between groups, left, mean ± standard deviation; right, Median + interquartile range box and whisker (95%) confidence interval. Plot color codes: Blue: Placebo-control pre-treatment; Red: Placebo-control post-treatment; Green: RES pre-treatment; Light blue: RES post-treatment. In RES-treated subjects, significant changes were seen in alpha-diversity, as measured by phylogenetic diversity (p = 0.01), and community structure, as measured by beta diversity (p = 0.007). There were no changes in the placebo group pre-and post-treatment.
