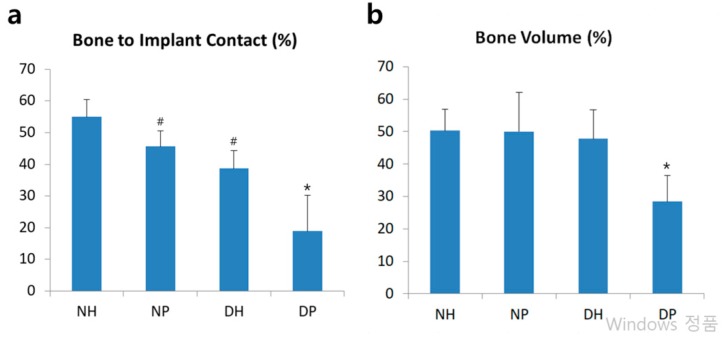
Figure 2.
Histomorphometric analysis. (a): Linear percentage of direct BIC in the total surface of implants. (b): Percentage of newly formed bone area in the circumferential zone within 100 μm of the implant surface. Data represent mean ± SD. *: p-value < 0.05 vs all other groups; #: p < 0.05 vs NH group.

