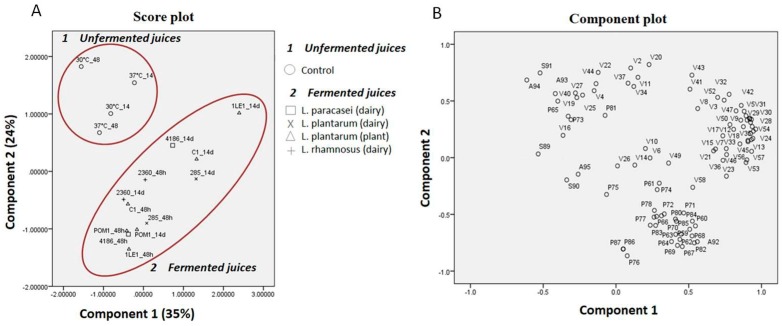
Figure 1.
Principal component analyses. (A) Score plot obtained from the analysis of unfermented (control) and fermented (L. plantarum, L. rhamnosus and L. paracasei) cherry juice. Each sample is identified by the strain number and the time of incubation. For example, 1LE1_48h is used for strain L. plantarum 1LE1 after fermentation. (B) Loading plot is based on sugars, organic acids, and volatile and phenolic compounds. Abbreviations are the same as used in Table S1 for organic acids (A) and sugars (S), Table S2 for volatile compounds (V), and Table S4 for polyphenols (P).

