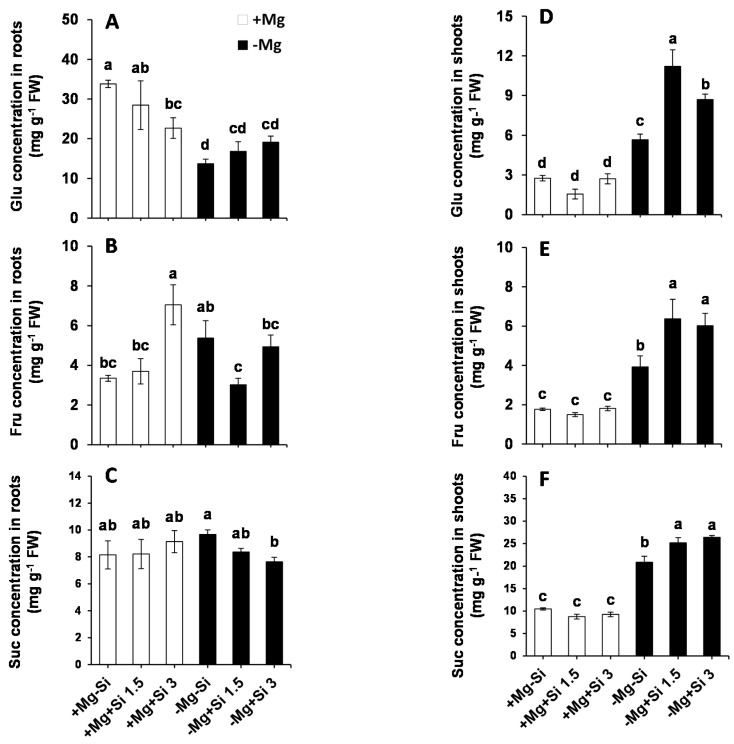
Figure 3.
Influence of Si supply on soluble sugars concentrations of maize plants subjected to Mg deficiency. (A) Glu concentration in roots, (B) Fru concentration in roots, (C) Suc concentration in roots, (D) Glu concentration in shoots, (E) Fru concentration in shoots, (F) Suc concentration in shoots of maize. Plants were grown in hydroponic culture under low Mg (0.02 mM) or normal Mg (0.5 mM) supply and two concentrations of Si (1.5 and 3 mM). Si provided in the second week of plant growth in hydroponic culture when Mg deficiency was applied. 21-days old plants were harvested 14 days after imposition of Mg deficiency. The white and black bars represent Mg-sufficient and Mg-deficient plants, respectively. Bars indicate means ± SE. Different letters denote significant differences according to LSD test (p < 0.05; n = 4).

