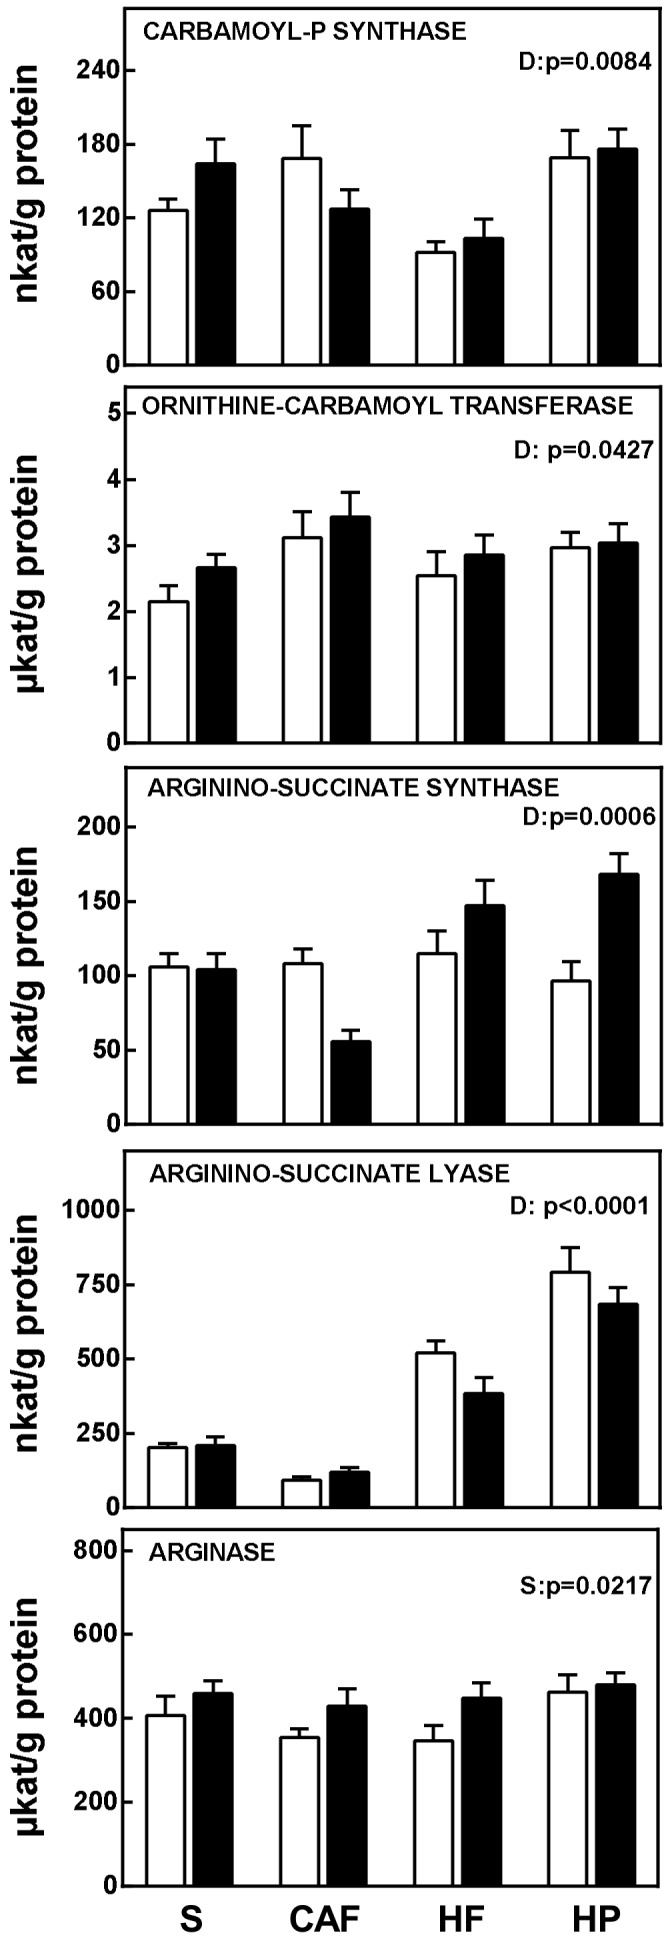
Figure 2.

Enzyme activities related to the urea cycle in the liver of male and female rats fed a standard, cafeteria, high-fat, or high-protein diet for 30 days. The data correspond to the mean ± SEM of 6–8 different animals, and are all expressed per gram of tissue protein. Females are represented in white bars, and males in black. Abbreviations: S is standard diet, CAF is cafeteria diet, HF is high-fat diet, and HP is high-protein diet. Statistical analysis was done using a two-way ANOVA program for diet (D) and sex (S). Only significant values are represented.
