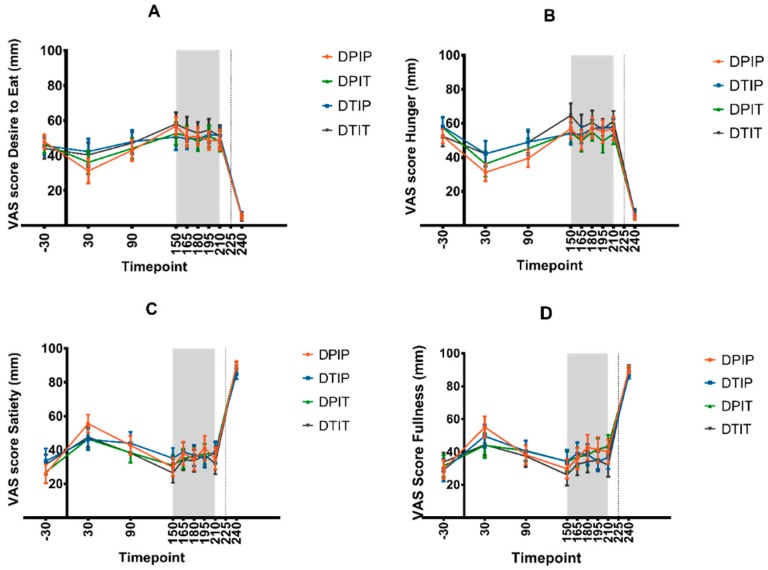
Figure 3.
VAS scores for desire to eat (A), hunger (B), satiety (C), and fullness (D) (mean + SEM) before, during, and after the infusion of placebo both intraduodenal and intraileal (DPIP), tastants intraduodenal and placebo intraileal (DTIP), placebo intraduodenal and tastants intraileal (DPIT), and tastants both intraduodenal and intraileal (DTIT). VAS scores were measured at t = −30, 30, 90, 150, 165, 180, 195, 210, and 240 min. No VAS scores were taken at t = 225 min. At t = 0 min, subjects received a standardized breakfast, infusion of mixtures was performed from t = 150 until t = 210 min, and ad libitum test meal was presented at t = 225. Based on a linear mixed model of mean scores and area under the curve (AUC150–210), no differences in desire to eat, hunger, satiety, and fullness were observed between the various conditions.

