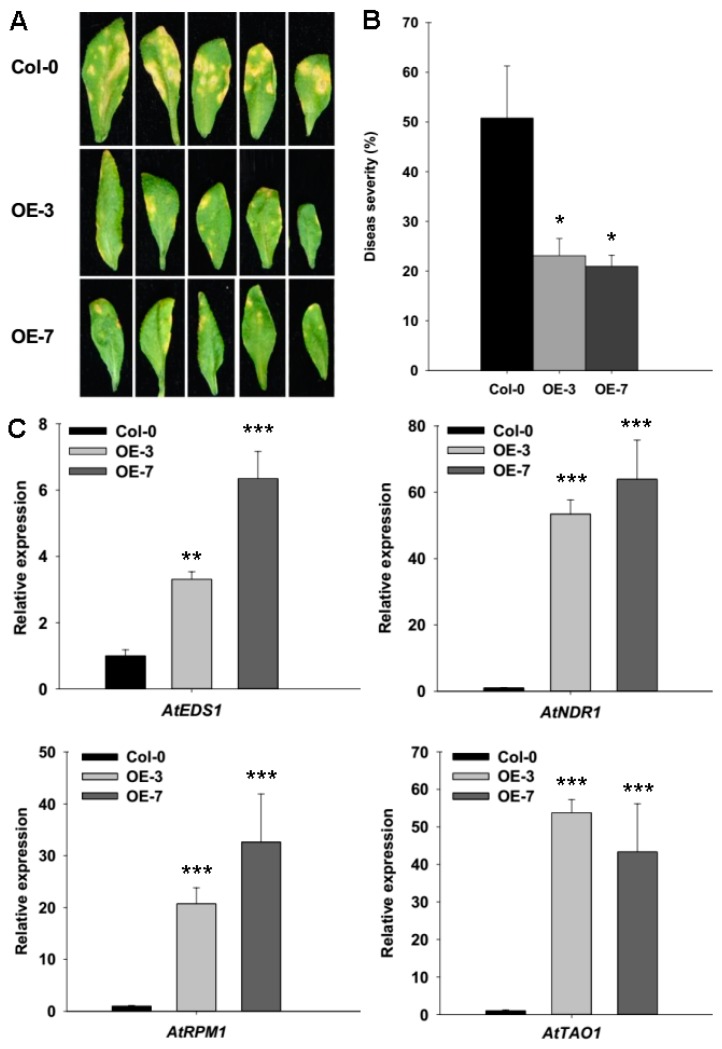
Figure 6.
Enhanced resistance of ZmRAD51A-OE transgenic Arabidopsis plants to Pst DC3000. (A) Phenotypes of ZmRAD51A-OE and Col-0 leaves after Pst DC3000 infected for 7 days. (B) Disease index of ZmRAD51A-OE and Col-0 plants infected by Pst DC3000. (C) Expression levels of defense-related genes in ZmRAD51A-OE and Col-0 plants infected by Pst DC3000. Data were normalized using the transcript level of AtUbiquitin [36]. The expression levels of genes in Col-0 plants infected by Pst DC3000 were used as the control and assigned value of 1. OE-3 and OE-7 represents two different transgenic lines of ZmRAD51A-OE Arabidopsis plants. Student’s test was performed between Col-0 plants and ZmRAD51A-OE transgenic lines (* p < 0.05, ** p < 0.01 and *** p < 0.001). Data represent means SD. Three biological replicates were performed.

