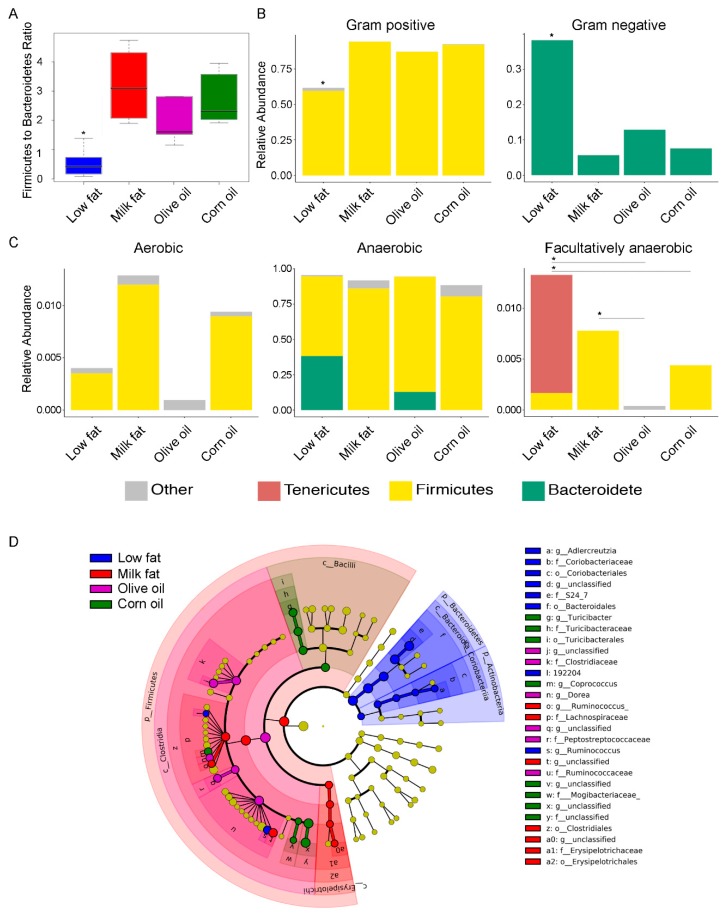
Figure 2.
The effect of lipid diets on the gut microbial taxa. (A) Comparison of the log abundance of the Firmicutes to Bacteroidetes ratio among experimental diet groups in the colon. The y-axis of the box plot indicates the log of the abundance of the Firmicutes divided by the abundance of Bacteroidetes. The low-fat group had a significantly lower Firmicutes to Bacteroidetes ratio than all the high-fat diets. Within the high-fat diets, olive oil had a significantly lower ratio of Firmicutes to Bacteroidetes than the milk fat group. (B) Relative abundances of Gram-positive and Gram-negative bacteria in the diet groups show a significantly lower abundance of gram positive bacteria and a corresponding higher abundance of gram negative bacteria in the low-fat dietary group. (C) Relative abundances of aerobic, anaerobic and facultatively anaerobic bacteria in the diet groups show significantly lower facultative anaerobic bacteria in the olive oil group compared to the milk fat and low-fat group. An asterisk above a single column indicates P < 0.05 for that group compared to every other group. An asterisk with a line connecting two groups indicates P < 0.05 between the two groups. (D) Differentially abundant microbial clades in the colon microbiota from mice fed high-fat diets composed of anhydrous milk fat, olive oil, corn oil or a low-fat normal chow. Cladogram represents taxonomic representation of statistically and biologically consistent differences among lipid diet groups. Significant differences are represented in the color of the most abundant class. Yellow circles represent non-significant microbial clades. The all-to-all version of LEfSe was used with Kruskal–Wallis test (P < 0.05). LDA score threshold was set at default value 2.

