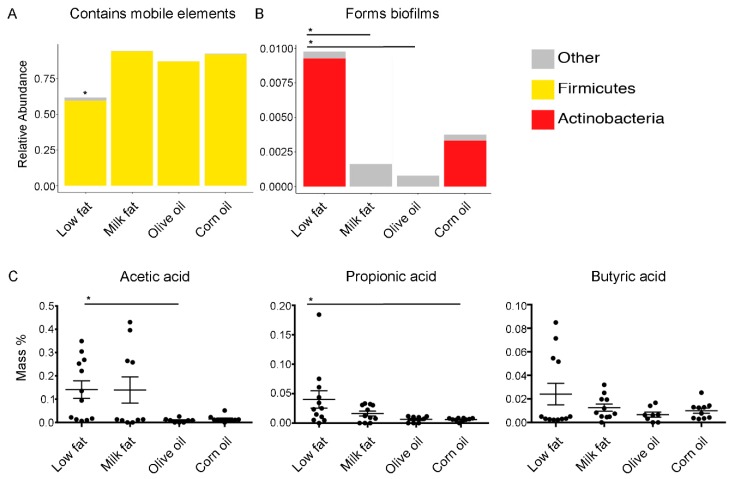
Figure 4.
Predicted bacterial virulence traits and quantified secondary metabolites. Virulence traits such as (A) the relative abundance of bacteria which contain mobile elements and (B) the relative abundance of bacteria which are able to form biofilms are displayed for each diet group. (C) The effect of lipid diets on short-chain fatty acid production. Short-chain fatty acid analysis performed via gas chromatography on cecal samples from mice fed high-fat diets composed of milk fat, olive oil, corn oil or a low-fat chow. Acetic, propionic, and butyric acid are expressed as mass % of total cecal tissue sample. Values are expressed as mean +/− SEM (n = 8–12). An asterisk above a single column indicates P < 0.05 for that group compared to every other dietary group. An asterisk with a line connecting two groups indicates P < 0.05 between the two groups.

