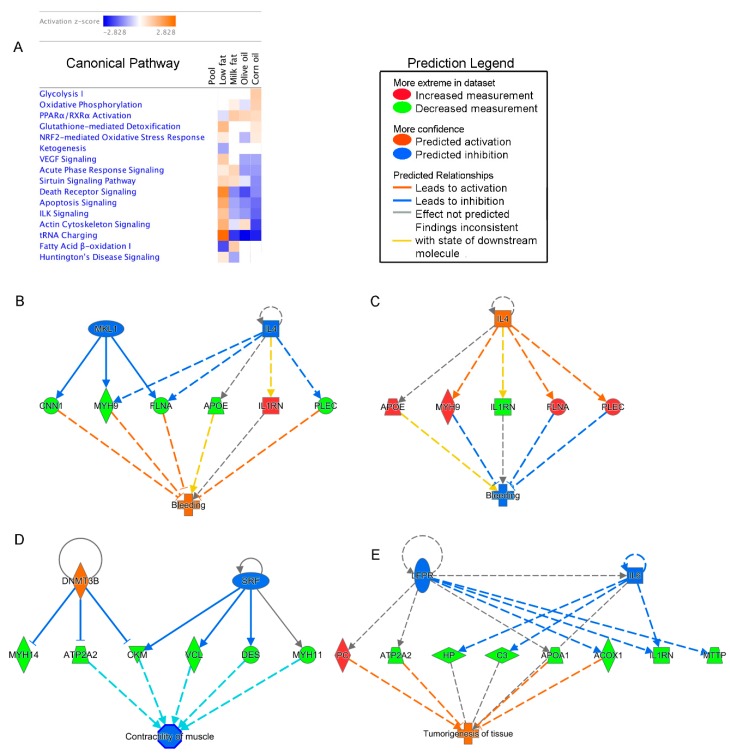
Figure 5.
Effects of lipid diets on the gut proteome shown by the Ingenuity pathway comparative analysis. (A) Heatmap visualization of metabolites detected in each dietary group. Orange color indicates a higher activation score, whereas blue color indicates a lower activation score. Ingenuity pathway analysis (IPA) identified many upstream regulators predicted to be active based on the gene expression profile including: (B) bleeding in the high-fat corn oil and (C) low-fat chow groups, (D) contractility of muscles in the corn oil group and (E) tumorigenesis of tissue in the olive oil group. Faded colors represent less of an effect.

