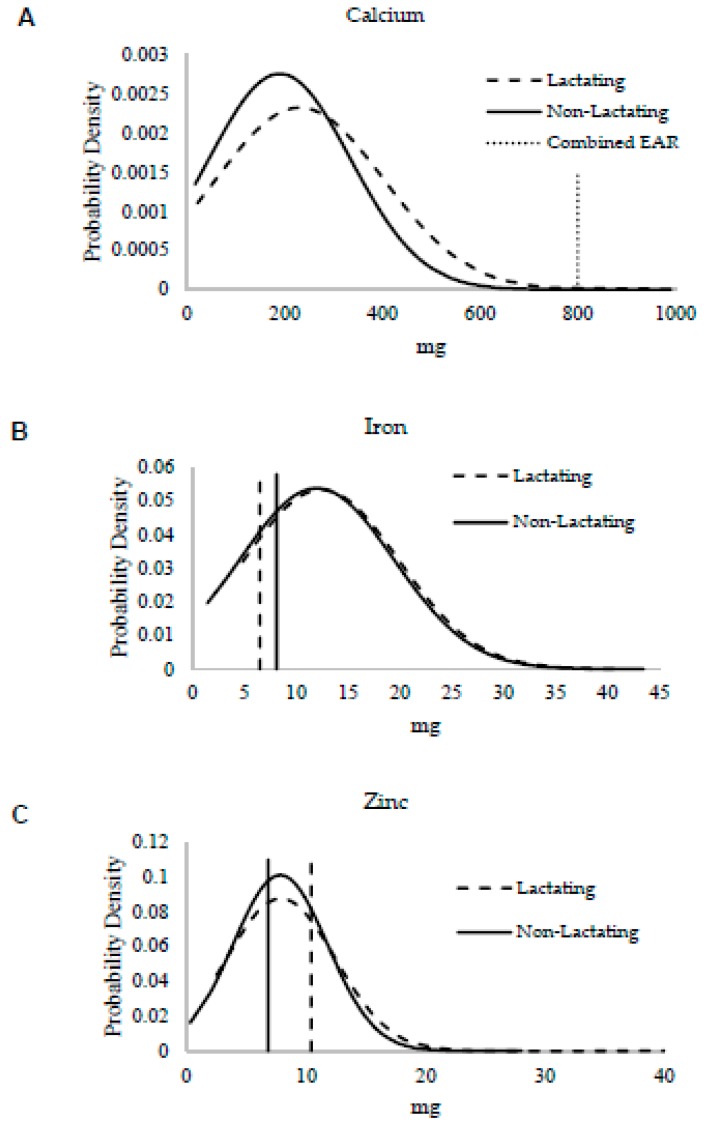
Figure 2.
Overlaid mineral intake distributions from lactating (dashed curved line) and non-lactating (solid curved line) women assessed by 24-h dietary recall for minerals with estimated average requirements (EARs). Vertical lines represent EARs for minerals for lactating women (dashed line) and non-lactating women (solid line), the dotted vertical line represents EARs that do not differ with lactation in the case of calcium. Two-sample t-tests were used to compare mean intake differences for each mineral: (A) calcium (p = 0.004), (B) iron (p = 0.54), and (C) zinc (p = 0.89).

