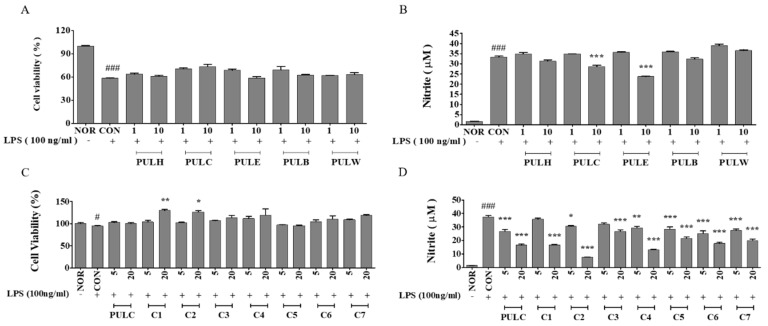
Figure 2.
Effects of P. ussuriensis Maxim leaves (PUL) samples on cell viability (A,C) and NO production in RAW 264.7 macrophages treated with various doses of PUL and PULC fraction (B,D). NOR, untreated group; CON, LPS-induced group; PULH, hexane fraction treated group; PULC, chloroform fraction treated group; PULE, ethyl acetate fraction treated group; PULB n-butanol fraction treated group; PULW, water fraction treated group; C1-C7, PULC sub-fractions treated group. Results are expressed as mean ± standard error of the mean (SEM), (N = 3) # p < 0.05, ### p < 0.001 vs. NOR group; * p < 0.05, ** p < 0.01, and *** p < 0.001 vs. CON group.

