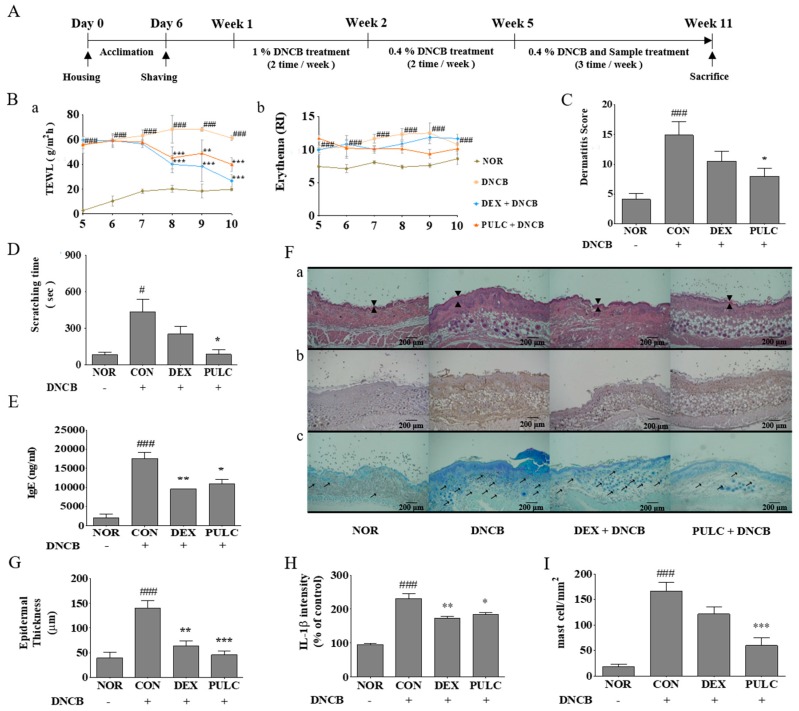
Figure 4.
Experimental schedule and effects of PULC in DNCB-induced NC/Nga mice. (A) Experimental schedule for the induction of atopic dermatitis (AD) lesions; (B) Trans-epidermal water loss (TEWL) and erythema scores (a) TEWL (b) erythema scores; (C) Weekly clinical skin severity scores; (D) Scratching time on the last day of the experiment; (E) IgE levels evaluated on the last day of the experiment using enzyme-linked immunosorbent assay (ELISA); (F) Histological examination (a) H&E stain, arrows indicate thickness of the epidermis (b) IL-1β stain (c) toluidine blue stain, arrows indicate mast cells (scale bar = 200 μm); (G) Epidermal thickness; (H) IL-1β intensity; (I) Mast cell count. NOR, untreated group; CON, DNCB-treated groups; DEX, positive control (Dexamethasone 0.1%) treated group; PULC, PULC 0.5% treated group. Data represent the mean ± SEM. (N = 9) # p < 0.05, ### p < 0.001 vs. the NOR group; * p < 0.05, ** p < 0.01, and *** p < 0.001 vs. CON group.

