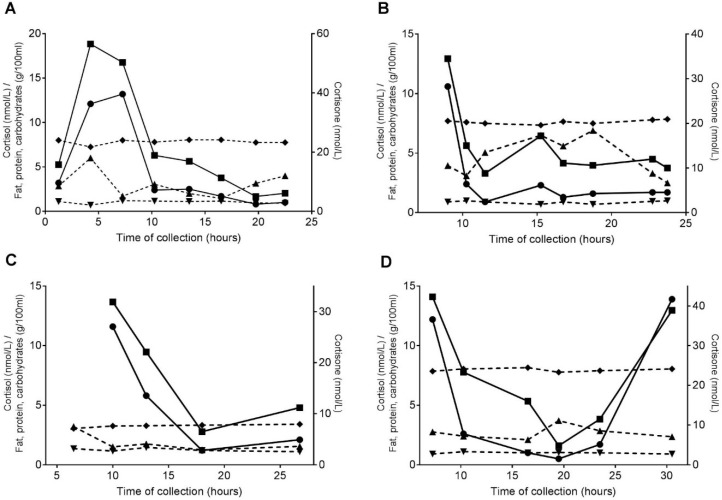
Figure 1.
(A–D) The individual plots for milk cortisol (●), cortisone (⬛), fat (▲), protein (▼), and carbohydrate (◆) concentrations for four mothers. Left y-axis: cortisol concentrations (nmol/L) and milk macronutrient concentrations (g/100 mL); right y-axis: cortisone concentrations (nmol/L); x-axis: time of collection (hours); continuous lines: GC concentrations; and dotted lines: macronutrient concentrations.

