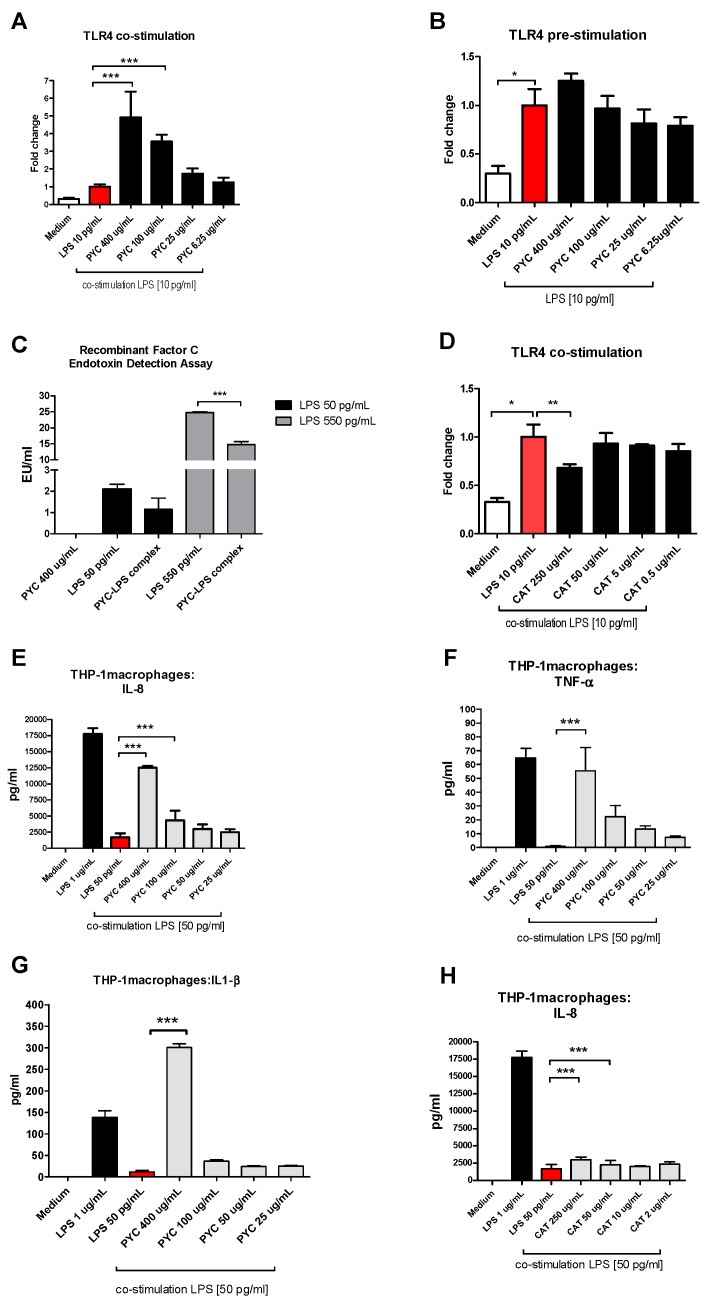
Figure 4.
PYC and LPS form complexes, which boost activation of TLR4. (A) PYC was pre-incubated with LPS (10 ng/mL) 30 min before addition to the TLR4-expressing HEK cells, followed by 24 h incubation. (B) TLR4-expressing HEK cells were pre-incubated with PYC, followed by washing and incubation with LPS (10 ng/mL) for 24 h. (C) LPS concentration in pure PYC sample (400 µg/mL) and after 30 min incubation with LPS standard (50 and 550 pg/mL) expressed in LPS units EU/mL. (D) CAT was pre-incubated with LPS (10ng/mL) for 30 min before addition to the TLR4-expressing HEK cells for 24 h. Results of A, B, and D are expressed as fold change of fluorescence intensity to the cells stimulated with 10 ng/mL LPS. Concentration of (E) interleukin (IL)-8, (F) tumor necrosis factor (TNF)-α, and (G) IL-1β in supernatants of THP-1 macrophages after incubation with LPS (1 and 50 pg/mL) and with PYC-LPS complexes formed during 30 min pre-incubation of LPS (50 pg/mL) with different concentrations of PYC. ((H) Concentration of IL-8 in supernatants of THP-1 macrophages after incubation with LPS (1 and 50 pg/mL) and with CAT-LPS complexes formed during 30 min pre-incubation of LPS (50 pg/mL) with different concentrations of CAT. All data (n = 4 technical replicates from two independent experiments) are expressed as the mean ± SD. p-values < 0.05 are considered statistically significant, as analyzed with one-way ANOVA with Tukey post hoc comparison test (GraphPad Prism). Significant differences are indicated by asterisks: * p < 0.05; ** p < 0.01; *** p < 0.001.

