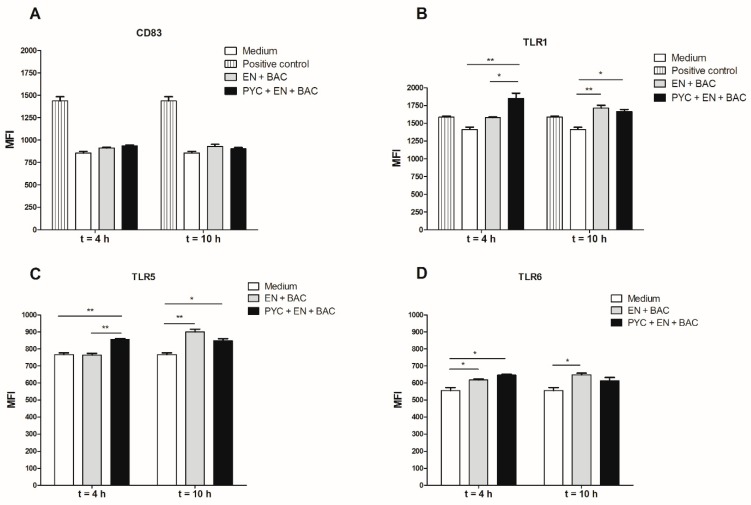
Figure 7.
Metabolized PYC up-regulates the expression of cluster of differentiation (CD) 83, TLR1, TLR5, and TLR6. THP-1 macrophages were incubated for 18h with dialysates collected after 4 h and 10 h of metabolism or PAM3 as positive control. After 18h of incubation, the cells were harvested and the expression of (A) CD83, (B) TLR1, (C) TLR5, and (D) TLR6 was determined and expressed as differences in mean fluorescence intensity (MFI). PYC samples were metabolized in the presence of E: enzymes; BAC: intestinal bacteria (human faecal suspension). All data are expressed as the mean ± SD of n = 4 independent replicates. p-values < 0.05 are considered statistically significant, as analyzed with one-way ANOVA with Tukey post hoc comparison test (GraphPad Prism). Significant differences are indicated by asterisks: * p < 0.05; ** p < 0.01.

