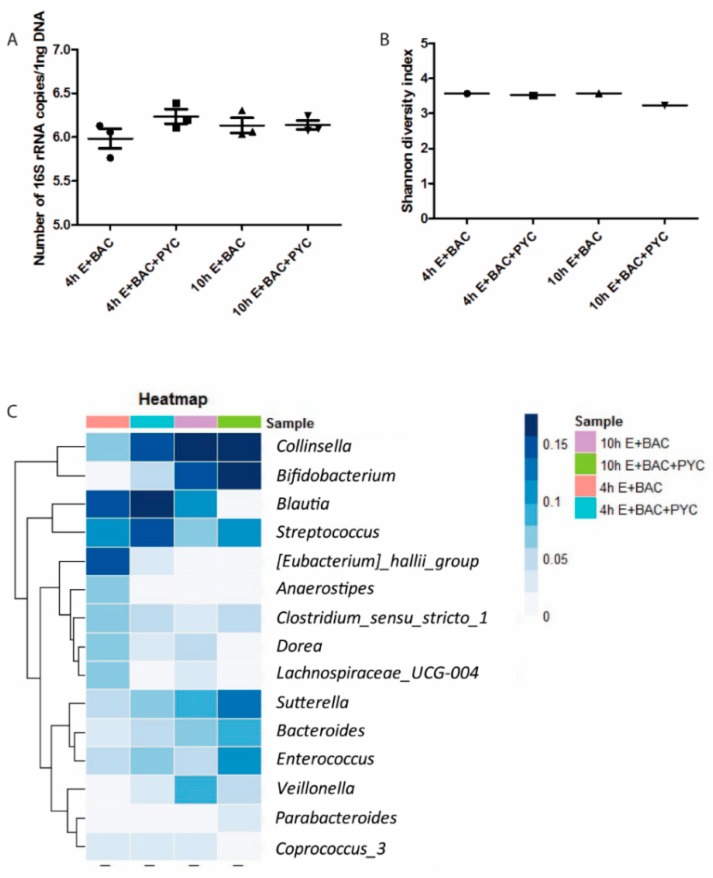
Figure 8.
PYC metabolites modulate microbiota composition. (A) Absolute abundance of total bacteria present in the four samples, determined by quantitative polymerase chain reaction (qPCR), with total counts log 10 transformed. (B) Alpha diversity of the four samples calculated using the Shannon diversity index, which accounts for both evenness and richness of a community. (C) Heatmap representing the relative abundances of the fifteen most abundantly present bacterialgenera. E: enzymes; BAC: intestinal bacteria (human faecal suspension). In A, mean and SD are shown of n = 3 independent determinations.

