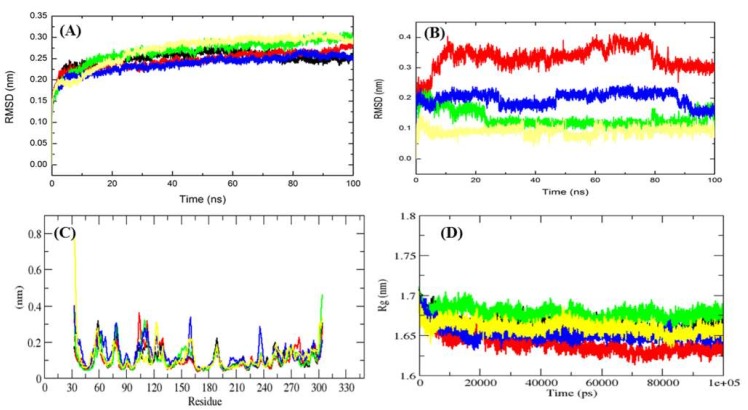
Figure 4.
Dynamics of ligands binding to the Mrlip1. (A) RMSD plot for Mrlip1 as a function of time. (B) RMSD plot for ligands as a function of time. (C) Backbone residual fluctuations (RMSF) plot. (D) Time evolution of radius of gyration (Rg). The values were presented during 100,000 ps (100 ns) MD simulations time scale. Black, red, green, blue, and yellow colors represent values obtained for Mrlip1, Mrlip1-RHC80267, Mrlip1-ZINC85530919, Mrlip1-ZINC95914464, and Mrlip1-ZINC85530320 complexes respectively.

