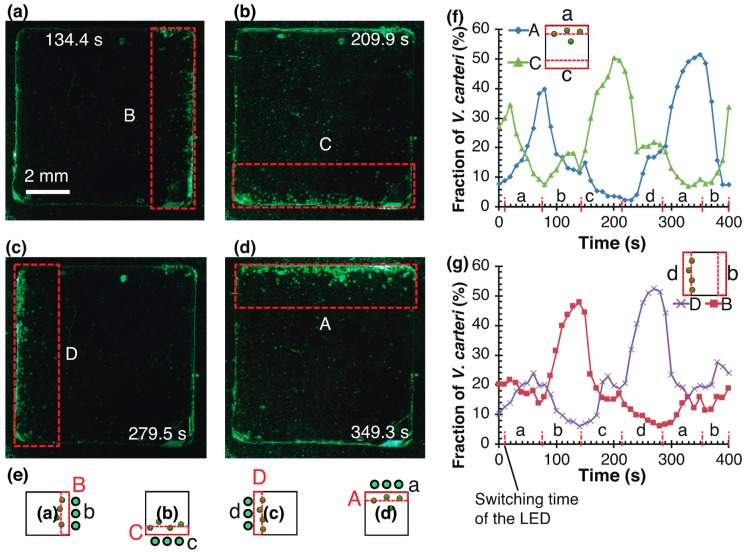
Figure 4.
Motion control results of V. carteri in a closed micro chamber with the light irradiation platform. (a–d) Micrographs showing a state of motion control of V. carteri (green points). (e) Schematic of Volvox in areas A–D with LEDs a–d. (f), (g) time is plotted on the horizontal axis and the number of V. carteri is plotted on the vertical axis. These graphs separately plot A, C and B, D that face each other. Red dashed lines represent the switching time of the LED (a, b, c, d).

